Prometheus
If you are using Prometheus for monitoring and the popular Grafana stack for dashboarding, you can expose Checkly’s core metrics on a dedicated, secured endpoint.
💡 Check out our blog post on using this integration with Prometheus and Grafana for some cool real-life applications.
Checkly exposes the following metrics in a Prometheus-compatible format.
| Metric | Description |
|---|---|
checkly_check_status |
Whether a check is passing or failing. 1 means the check is passing, 0 means the check is failing. |
checkly_check_degraded_status |
Whether a check is degraded. 1 means the check is not-degraded, 0 means the check is degraded. |
checkly_check_result |
The last collected response time for a check in a specific region. This means you get one checkly_check_result stanza for each region the check is configured to run in. |
checkly_private_location_queue_size |
The number of check runs scheduled to a private location and waiting to be executed. In particular, this metric reports the maximum count of scheduled check runs over the past 10 minutes. |
checkly_private_location_oldest_scheduled_check_run |
The age in seconds of the oldest scheduled job in the private location’s queue. In particular, this metric reports the maximum age from the past 10 minutes. |
checkly_private_location_agent_count |
The number of connected Checkly Agents connected for a private location. An Agent is considered as connected if it’s communicated with the Checkly infrastructure in the past 10 minutes. |
Each checkly_check metric has the following labels:
check_name, the name of your check.check_type, eitherapiorbrowser.tags, this check’s tags.
key:value tags in your checks/groups and they will be exported as custom labels in Prometheus. For instance the tag env:production will be exposed as a custome label env="production". You can disable this by adding the query param disableTagParsing=true.The checkly_private_location metrics contain the labels:
private_location_name, the name of the private location.private_location_slug_name, the private location’s human readable unique identifier.private_location_id, the private location’s UUID.
checkly_private_location metrics won’t be reported for it.Here is an example:
# HELP checkly_check_status The status of the last check. 1 is passing, 0 is failing
# TYPE checkly_check_status gauge
checkly_check_status{check_name="Customer API",check_type="api",muted="false",activated="true",tags="alerts,public"} 1
checkly_check_status{check_name="Email login",check_type="browser",muted="false",activated="true",tags="auth,browser-checks,public"} 0
# HELP checkly_check_degraded_status The degraded status of the last check. 1 is not-degraded, 0 is degraded
# TYPE checkly_check_degraded_status gauge
checkly_check_degraded_status{check_name="Customer API",check_type="api",muted="false",activated="true",tags="alerts,public"} 0
checkly_check_degraded_status{check_name="Email login",check_type="browser",muted="false",activated="true",tags="auth,browser-checks,public"} 1
# HELP checkly_check_result The response time of the last check per region.
# TYPE checkly_check_result gauge
checkly_check_result{check_name="Customer API",check_type="api",region="ap-northeast-2",tags="alerts,public"} 1168
checkly_check_result{check_name="Customer API",check_type="api",region="ap-southeast-1",tags="alerts,public"} 932
checkly_check_result{check_name="Customer API",check_type="api",region="ca-central-1",tags="alerts,public"} 424
checkly_check_result{check_name="Customer API",check_type="api",region="eu-west-2",tags="alerts,public"} 138
checkly_check_result{check_name="Customer API",check_type="api",region="us-east-2",tags="alerts,public"} 432
checkly_check_result{check_name="Email login",check_type="browser",region="ap-south-1",tags="auth,browser-checks,public"} 10174
# HELP checkly_private_location_queue_size The number of check runs scheduled to the private location and waiting to be executed.
# TYPE checkly_private_location_queue_size gauge
checkly_private_location_queue_size{private_location_name="Internal CI",private_location_slug_name="internal-ci",private_location_id="cac52f2d-8b8c-4ca5-9711-1836be02eda4"} 0
# HELP checkly_private_location_oldest_scheduled_check_run The age in seconds of the oldest check run job scheduled to the private location queue.
# TYPE checkly_private_location_oldest_scheduled_check_run gauge
checkly_private_location_oldest_scheduled_check_run{private_location_name="Internal CI",private_location_slug_name="internal-ci",private_location_id="cac52f2d-8b8c-4ca5-9711-1836be02eda4"} 0
# HELP checkly_private_location_agent_count The number of agents connected for the private location.
# TYPE checkly_private_location_agent_count gauge
checkly_private_location_agent_count{private_location_name="Internal CI",private_location_slug_name="internal-ci",private_location_id="cac52f2d-8b8c-4ca5-9711-1836be02eda4"} 1
Notice that:
- The check for “Email login” is failing.
- The check for “Customer API” is degraded, but not failing.
- The
checkly_check_statusmetric hasmutedandactivatedlabels, reflecting if a check is sending out alerts or is actually running. - The
checkly_check_resultmetric has aregionlabel. - The private location “Internal CI” has one Checkly Agent connected. From
checkly_private_location_queue_sizeandcheckly_private_location_oldest_scheduled_check_run, we see that there’s no backlog of check run jobs.
Activating this integration is simple.
-
Navigate to the integrations tab on the account screen and click the ‘Create Prometheus endpoint’ button.

-
We directly create an endpoint for you and five your the URL and the required Bearer token.
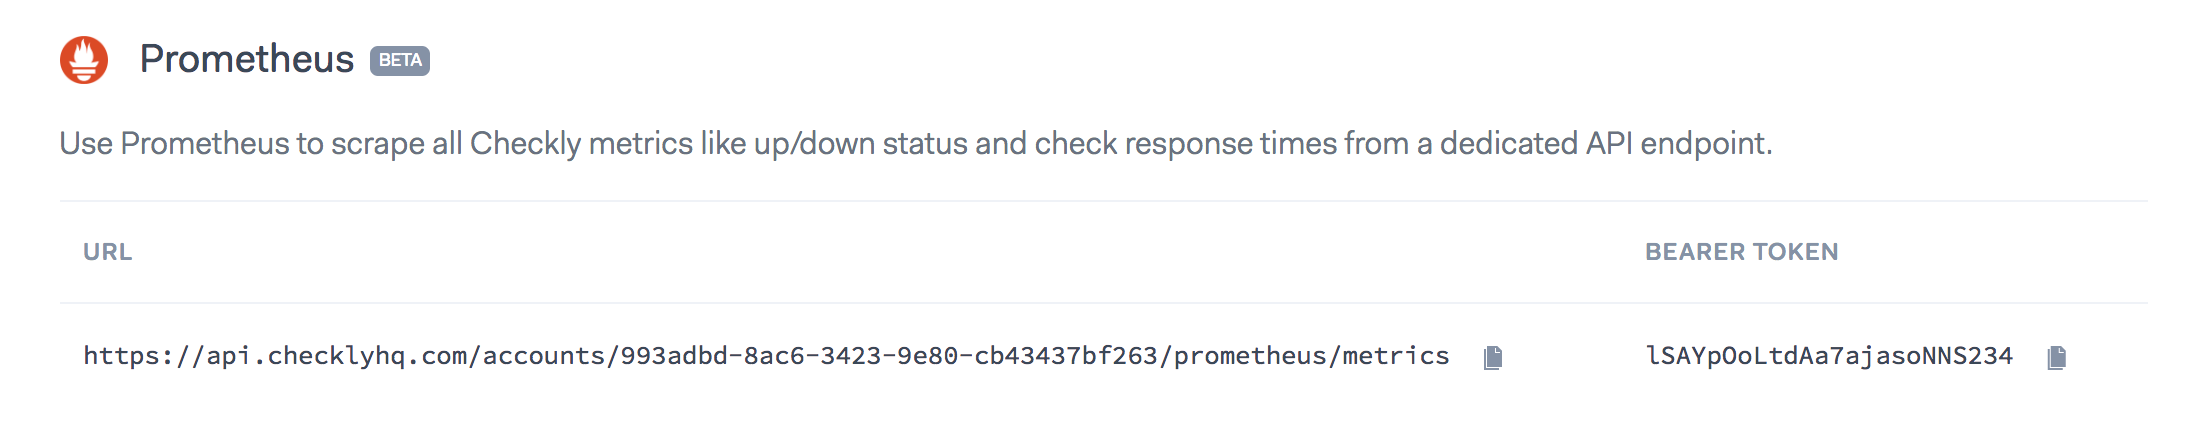
-
Create a new job in your Prometheus
prometheus.ymlconfig and set up a scraping interval. We recommend an interval between 30 seconds and 60 seconds. Add the URL (divided intometrics_path,schemeandtarget) andbearer_token. Here is an example
# prometheus.yml
- job_name: 'checkly'
  scrape_interval: 30s
  metrics_path: '/accounts/993adb-8ac6-3432-9e80-cb43437bf263/prometheus/metrics'
  bearer_token: 'lSAYpOoLtdAa7ajasoNNS234'
  scheme: https
  static_configs:
  - targets: ['api.checklyhq.com']
Now restart Prometheus and you should see metrics coming in.
![]() You can contribute to this documentation by editing this page on Github
You can contribute to this documentation by editing this page on Github