Check results
If you have checks running, you can select them on the main Checkly dashboard and get an overview of the results they have produced so far.
Check results overview
Select a check and you will see a breakdown of its recent runs, together with key availability and performance metrics.
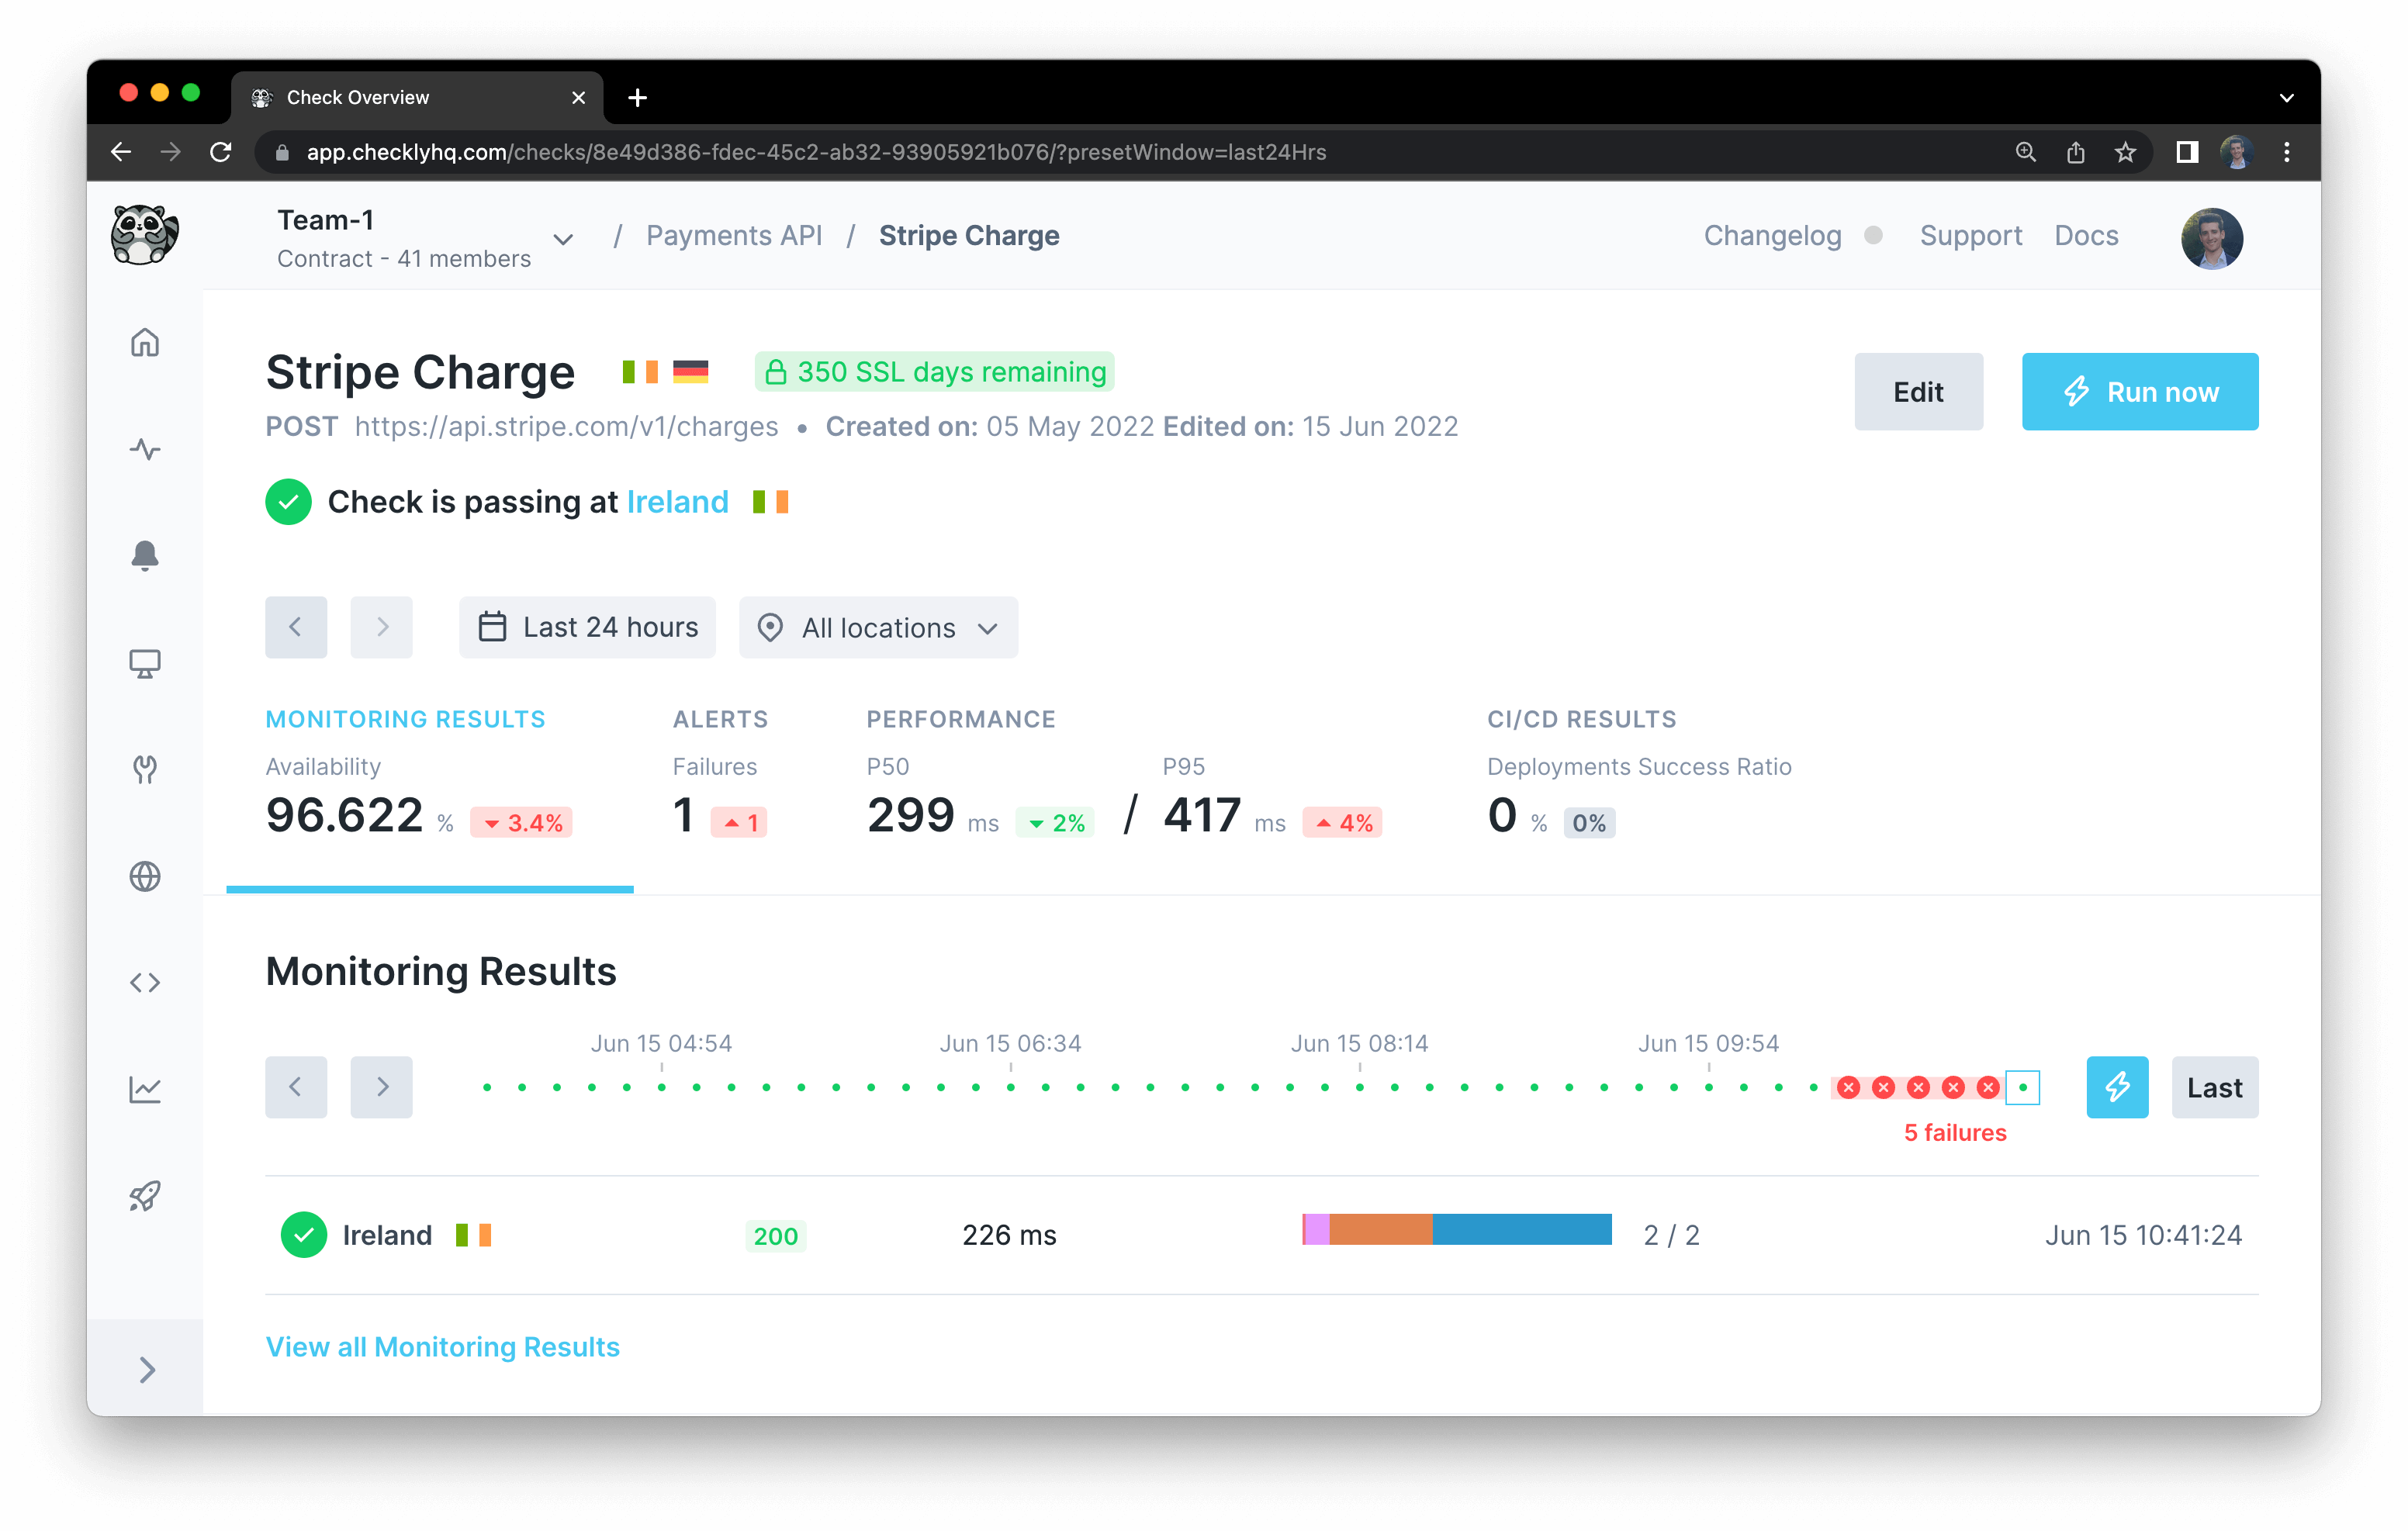
Summary section
The summary at the top of the page allows for filtering based all of the page’s data points based on the selected timeframe and locations.
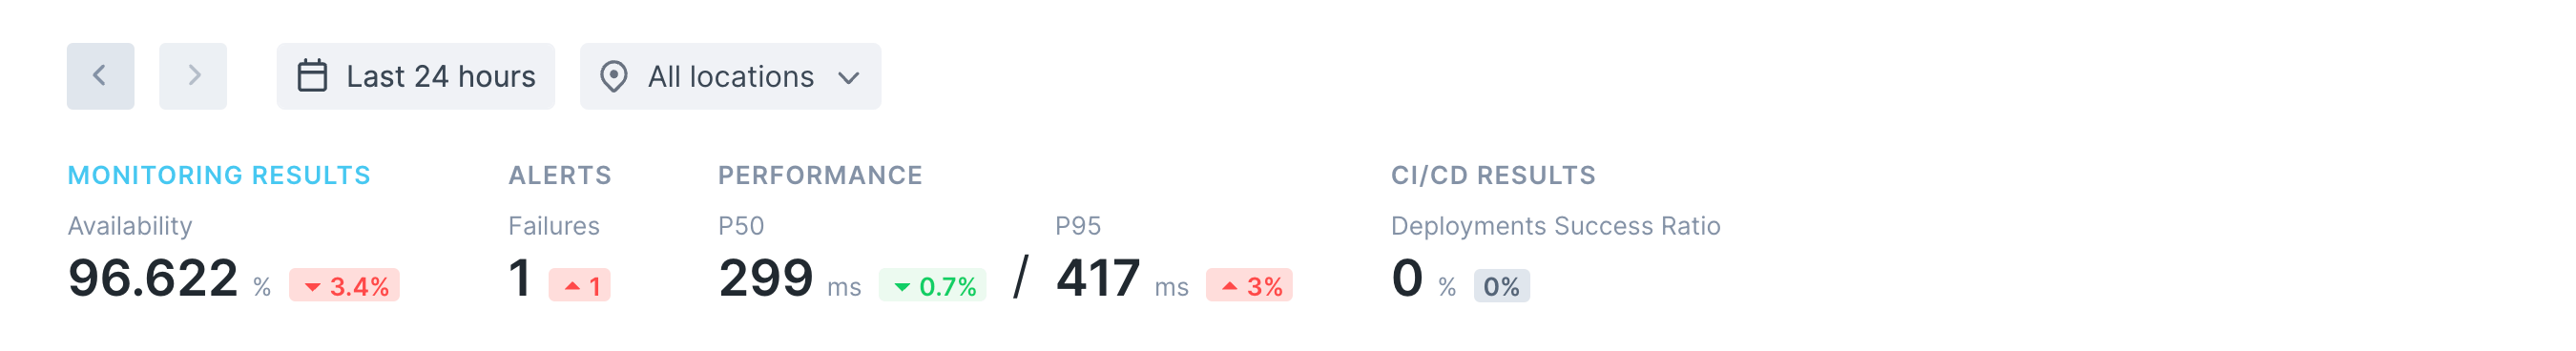
Based on the user’s selection, the metrics in the summary will also be updated to show the most important numbers at a glance. Single tabs in the summary can be clicked to skip to the related section of the page showing a more detailed breakdown of the relevant information.
Time ribbon
Single check runs can be accessed by selecting them on the time ribbon or by hovering dots and clicking View Details. View Details will open the selected check run in a new browser tab; a simple click on a time ribbon dot will show a preview of the selected check run below it.
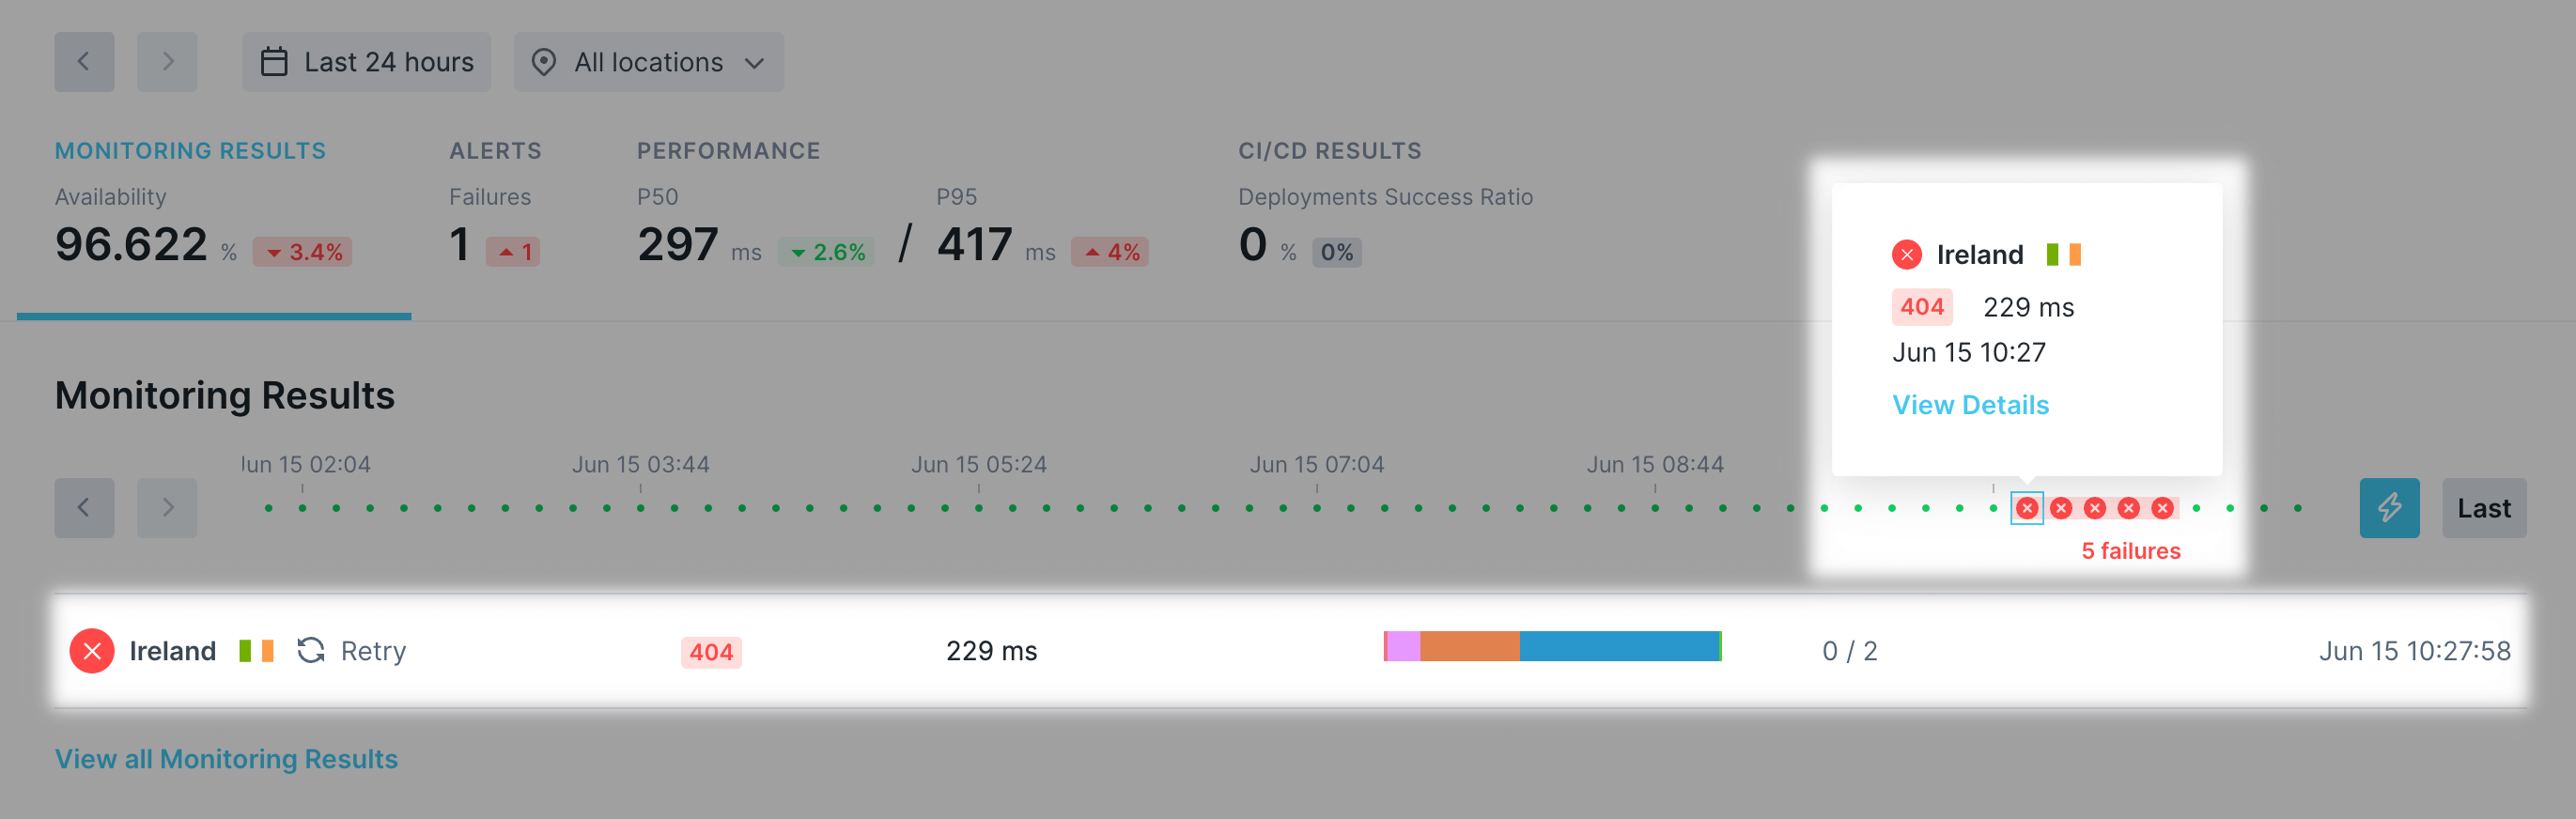
Selecting a check execution will take you to the dedicated check result page for it, which will look different based on whether you had been running a Browser or an API check.
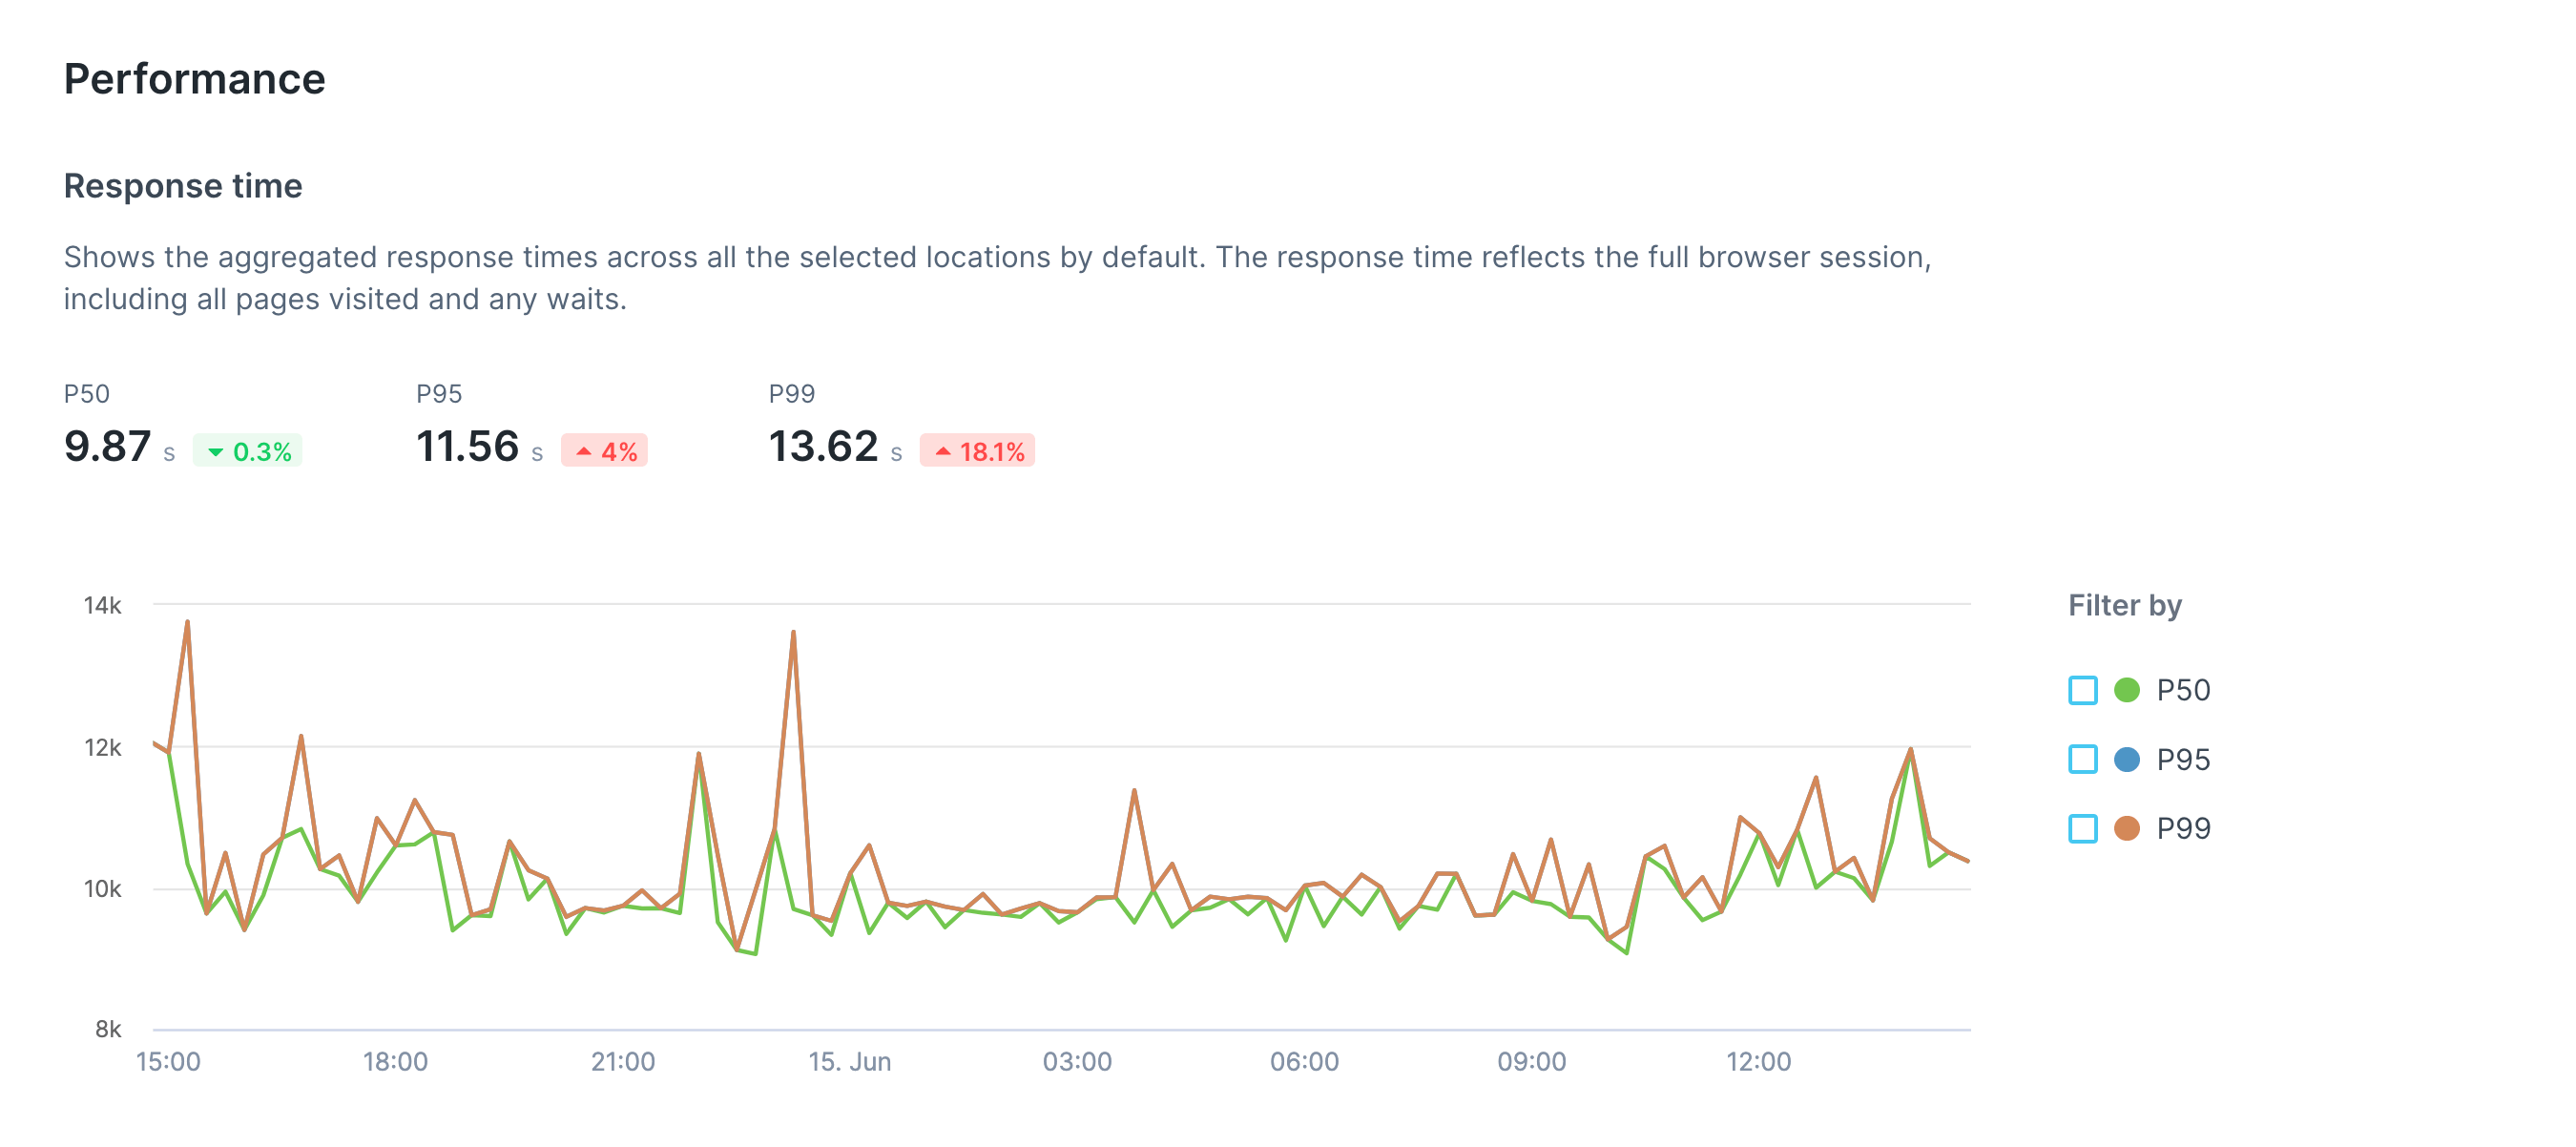
Performance
Depending on the type of check, different performance metrics will be shown in the Performance section.
For Browser checks, several performance metrics are shown in separate charts:
-
The total duration of the browser session
-
Load timings for the first page navigation
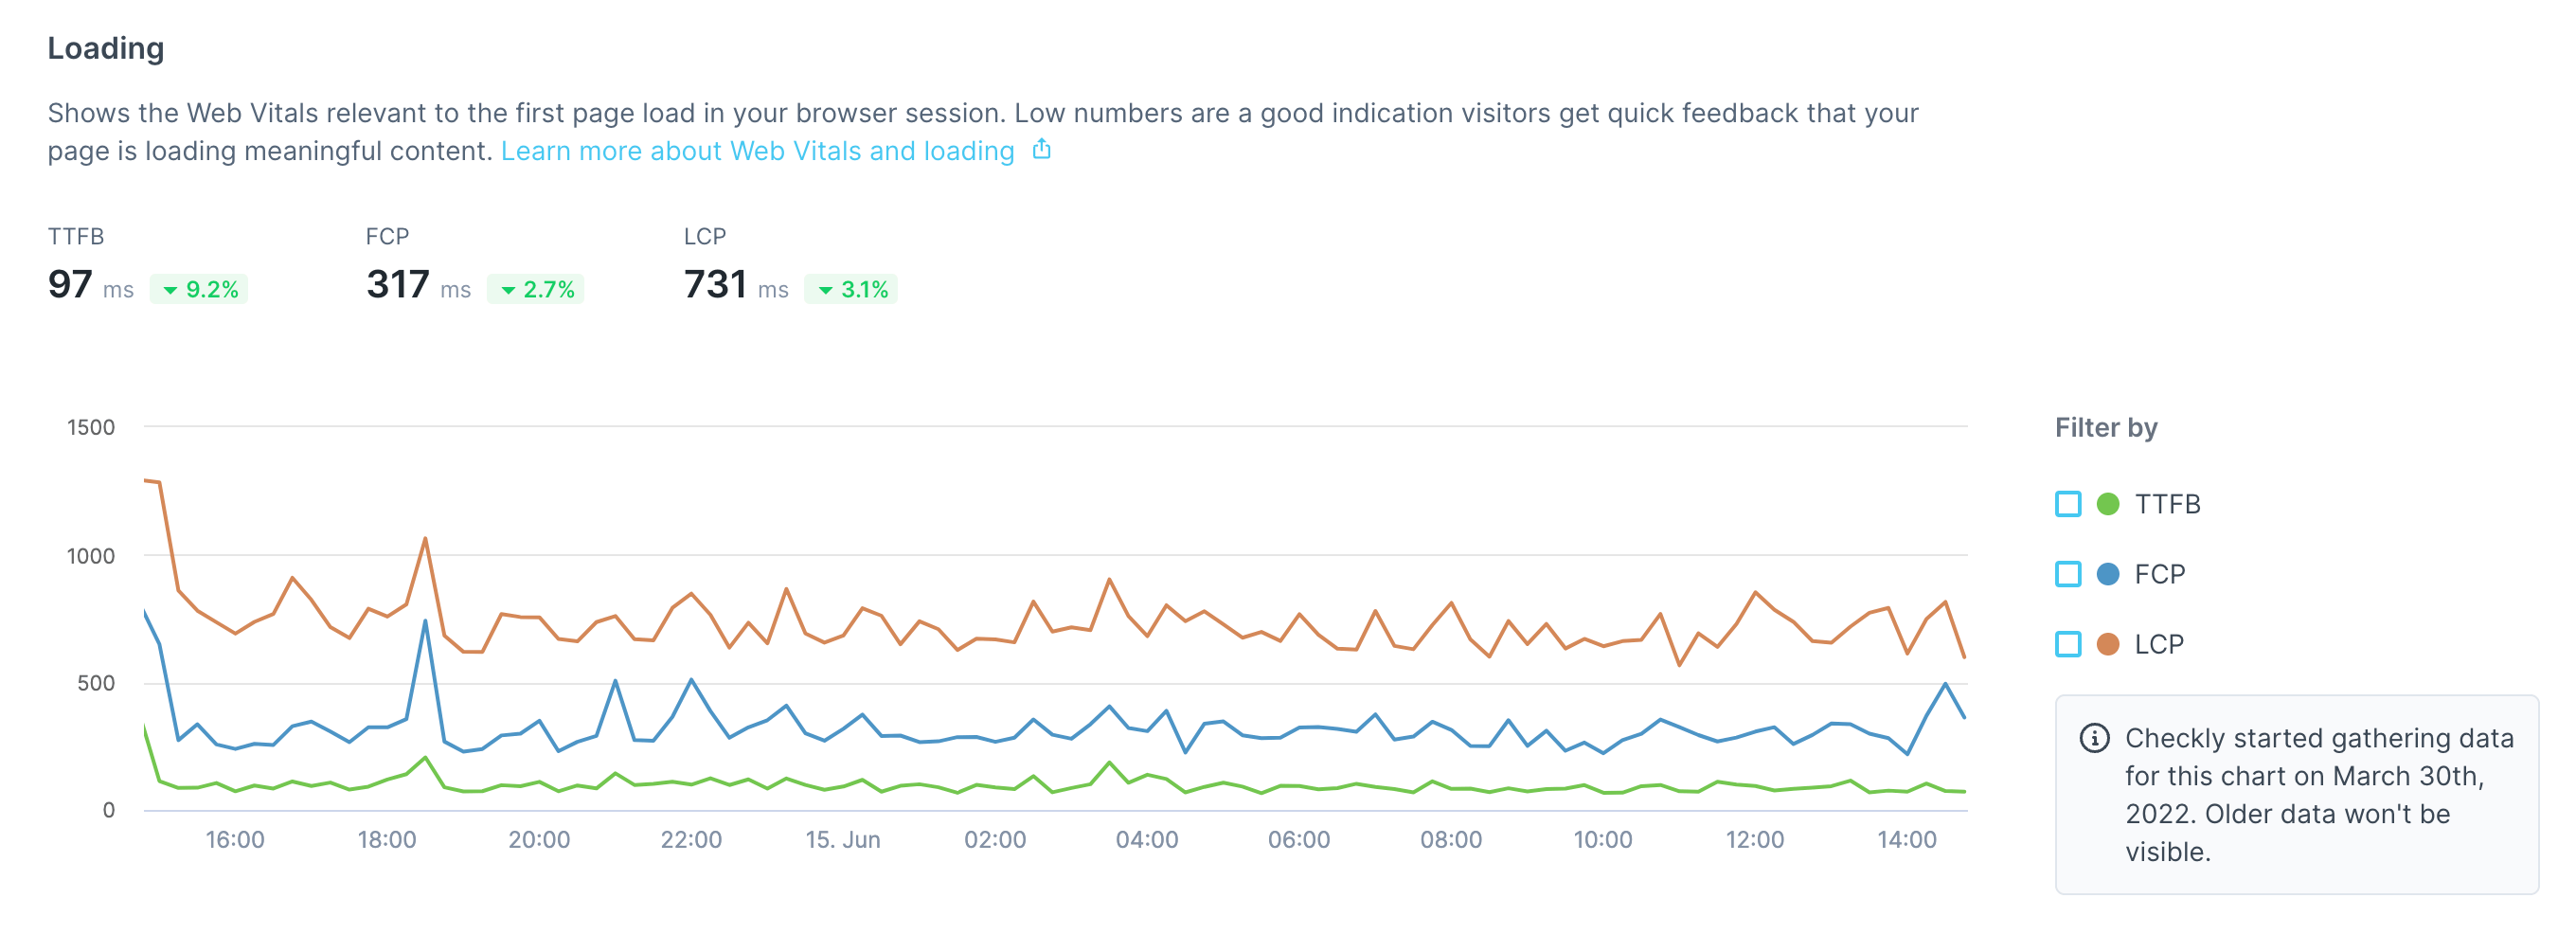
-
A breakdown of different error types
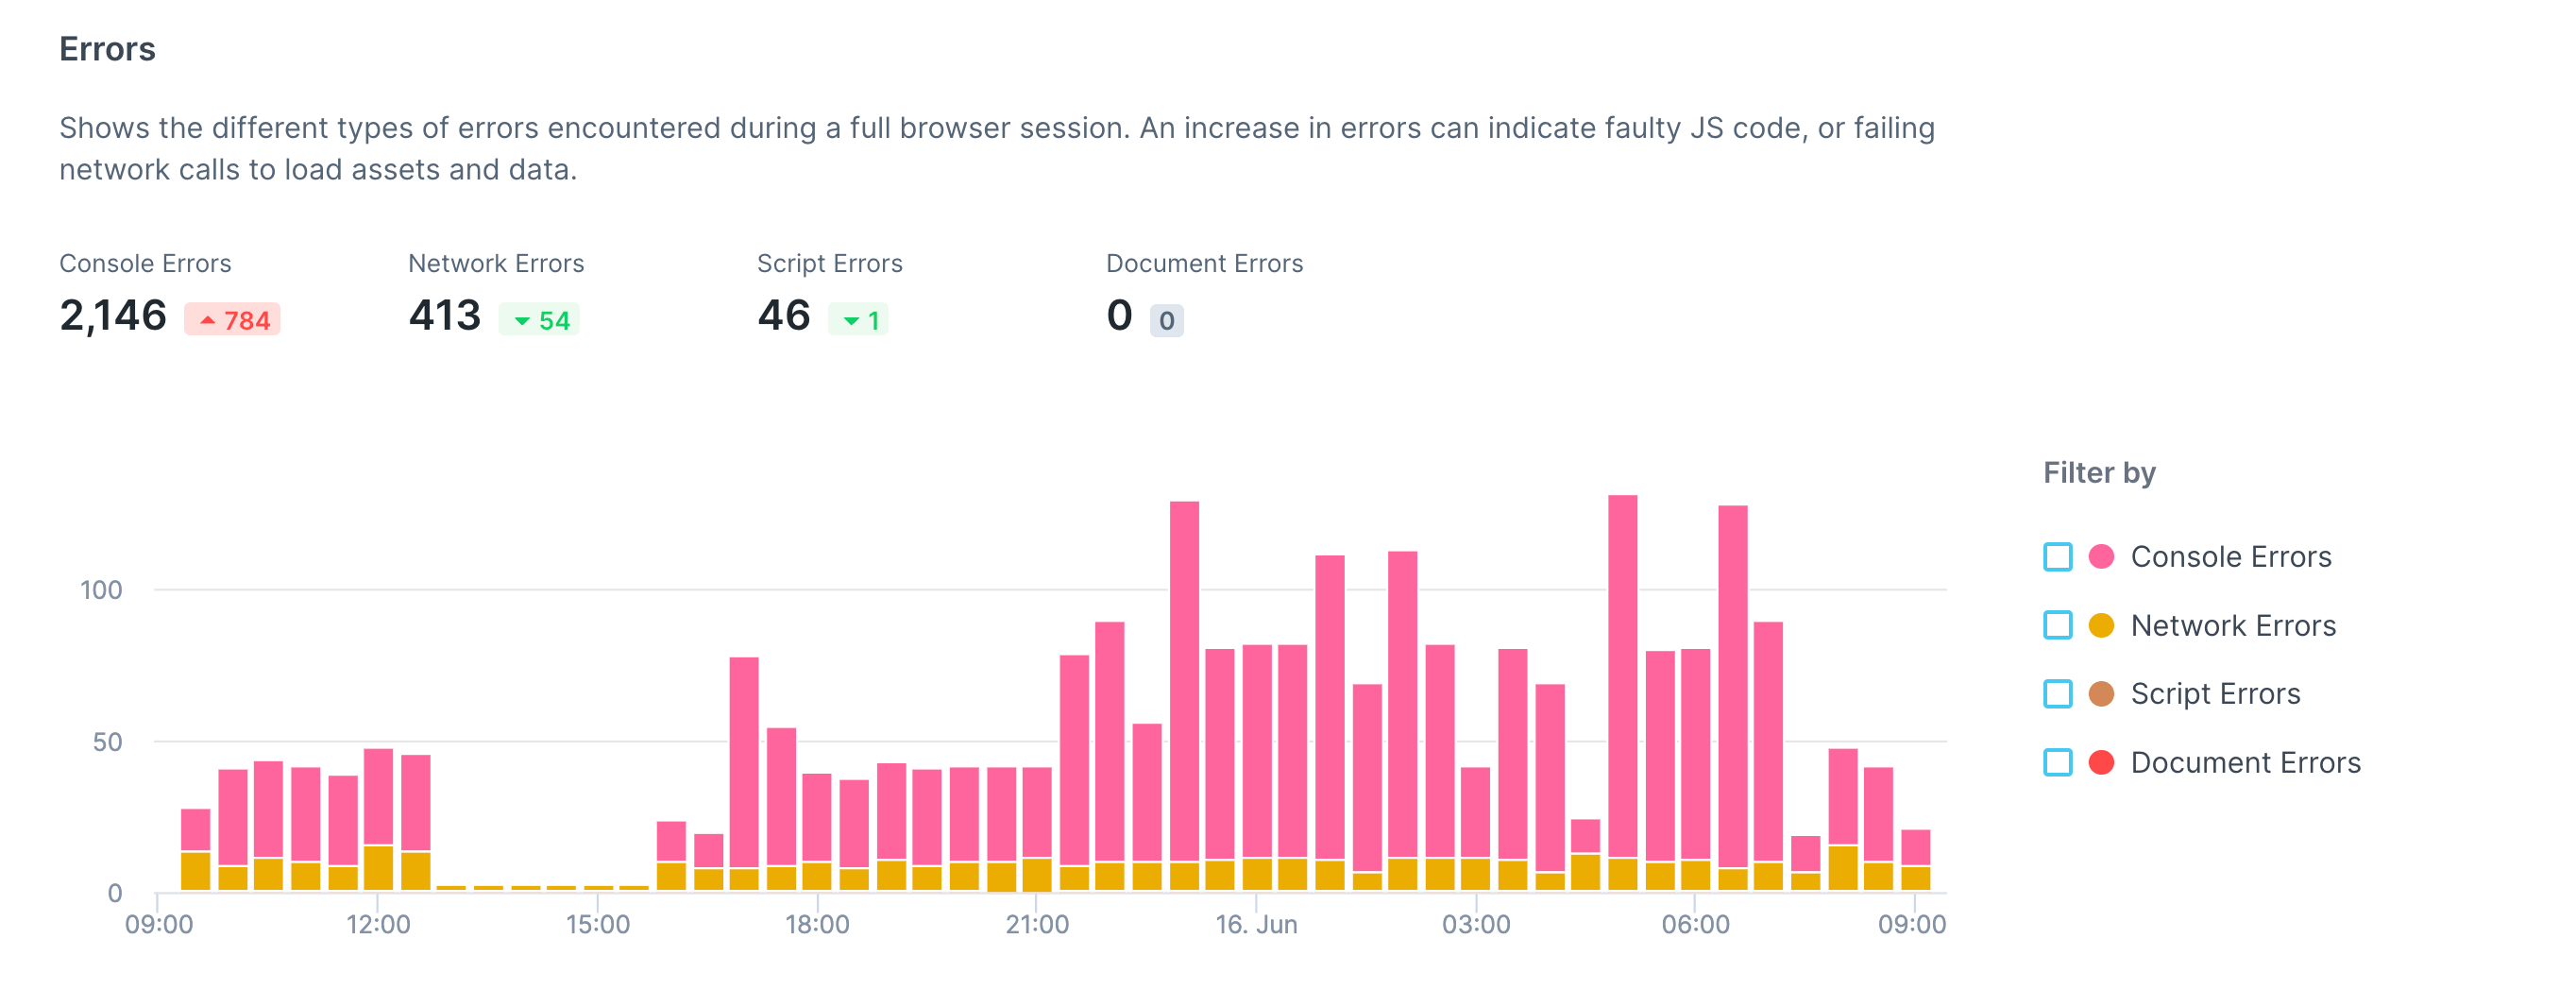
-
An interactivity summary
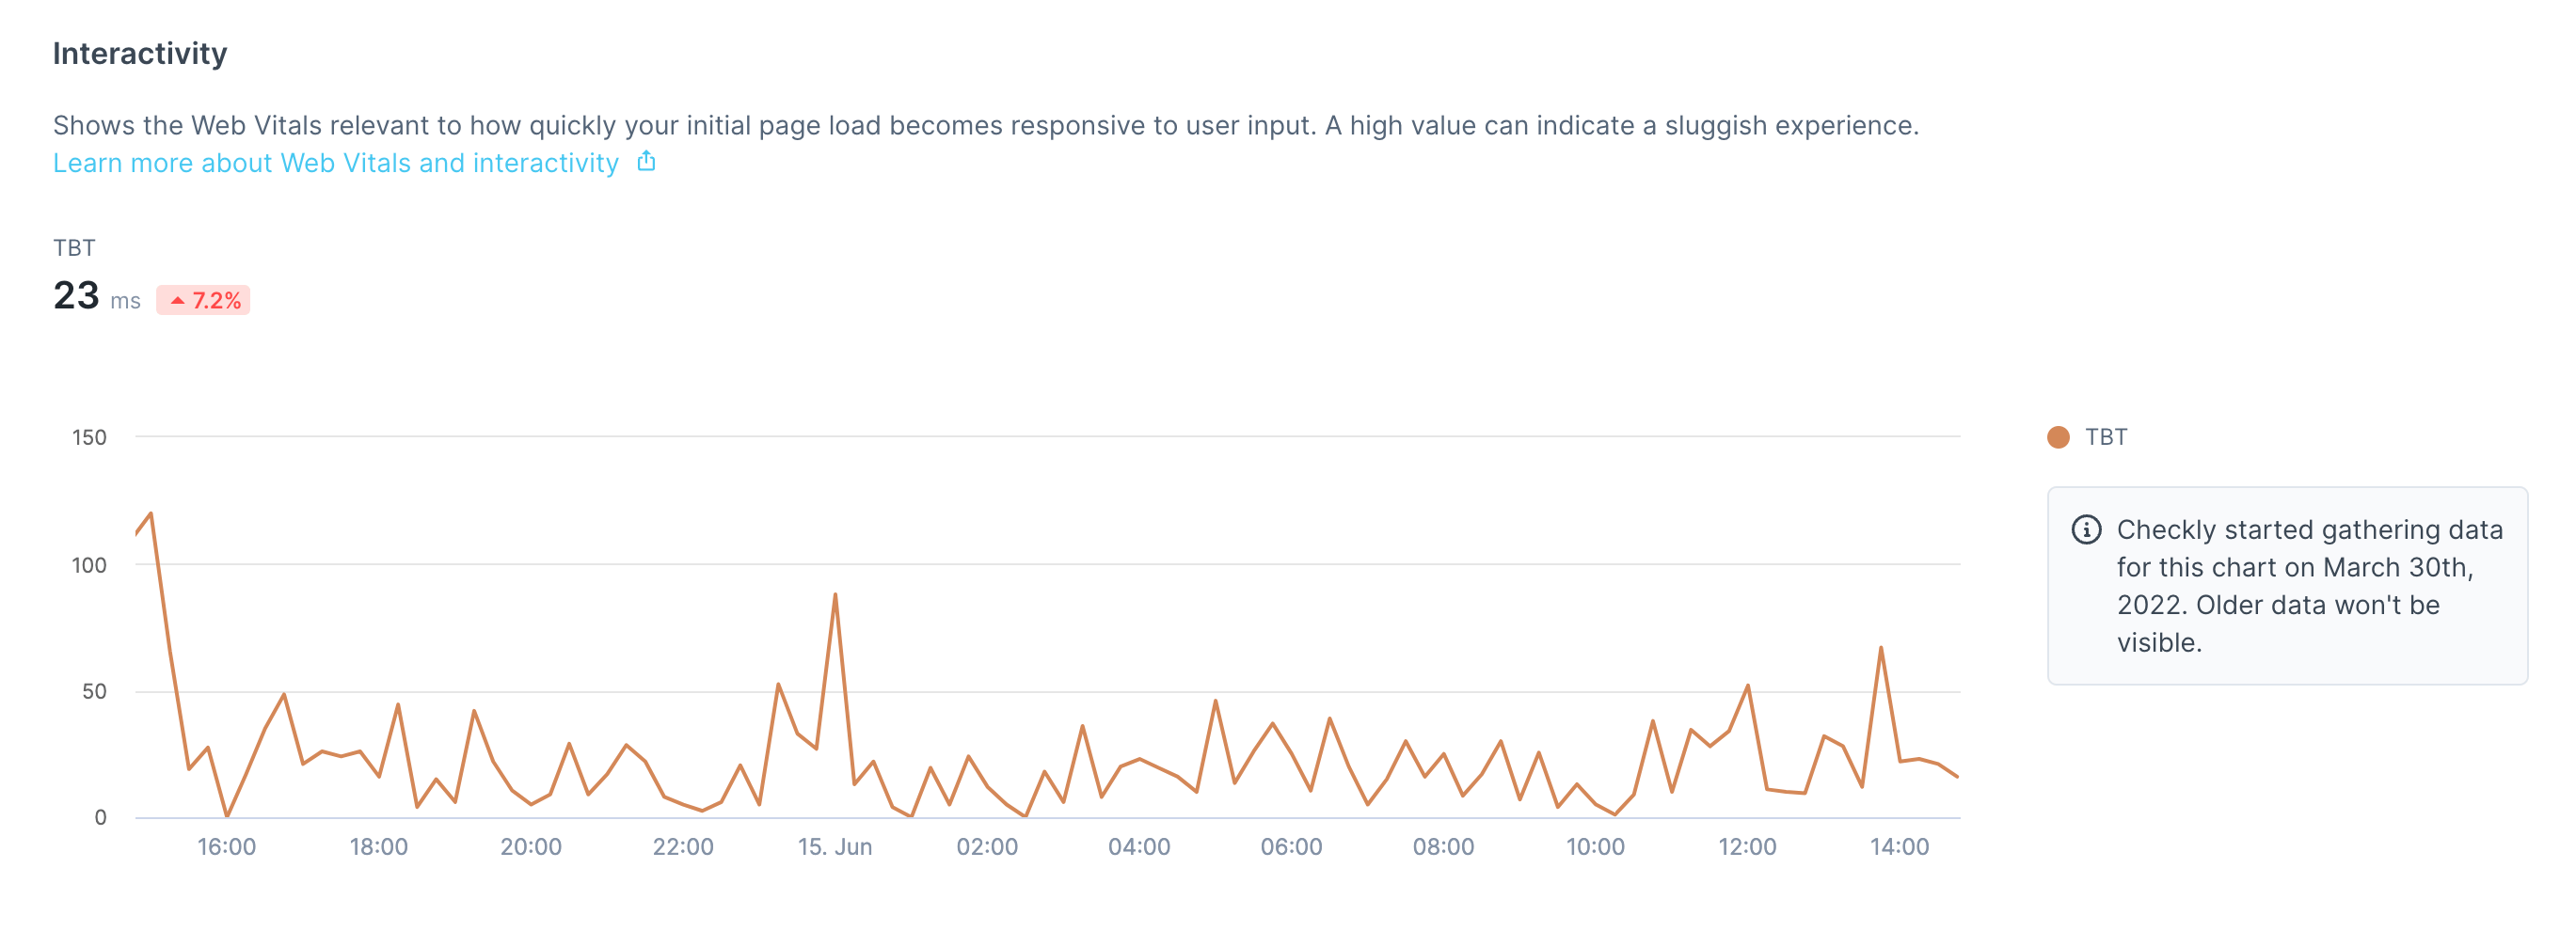
-
A visual stability breakdown
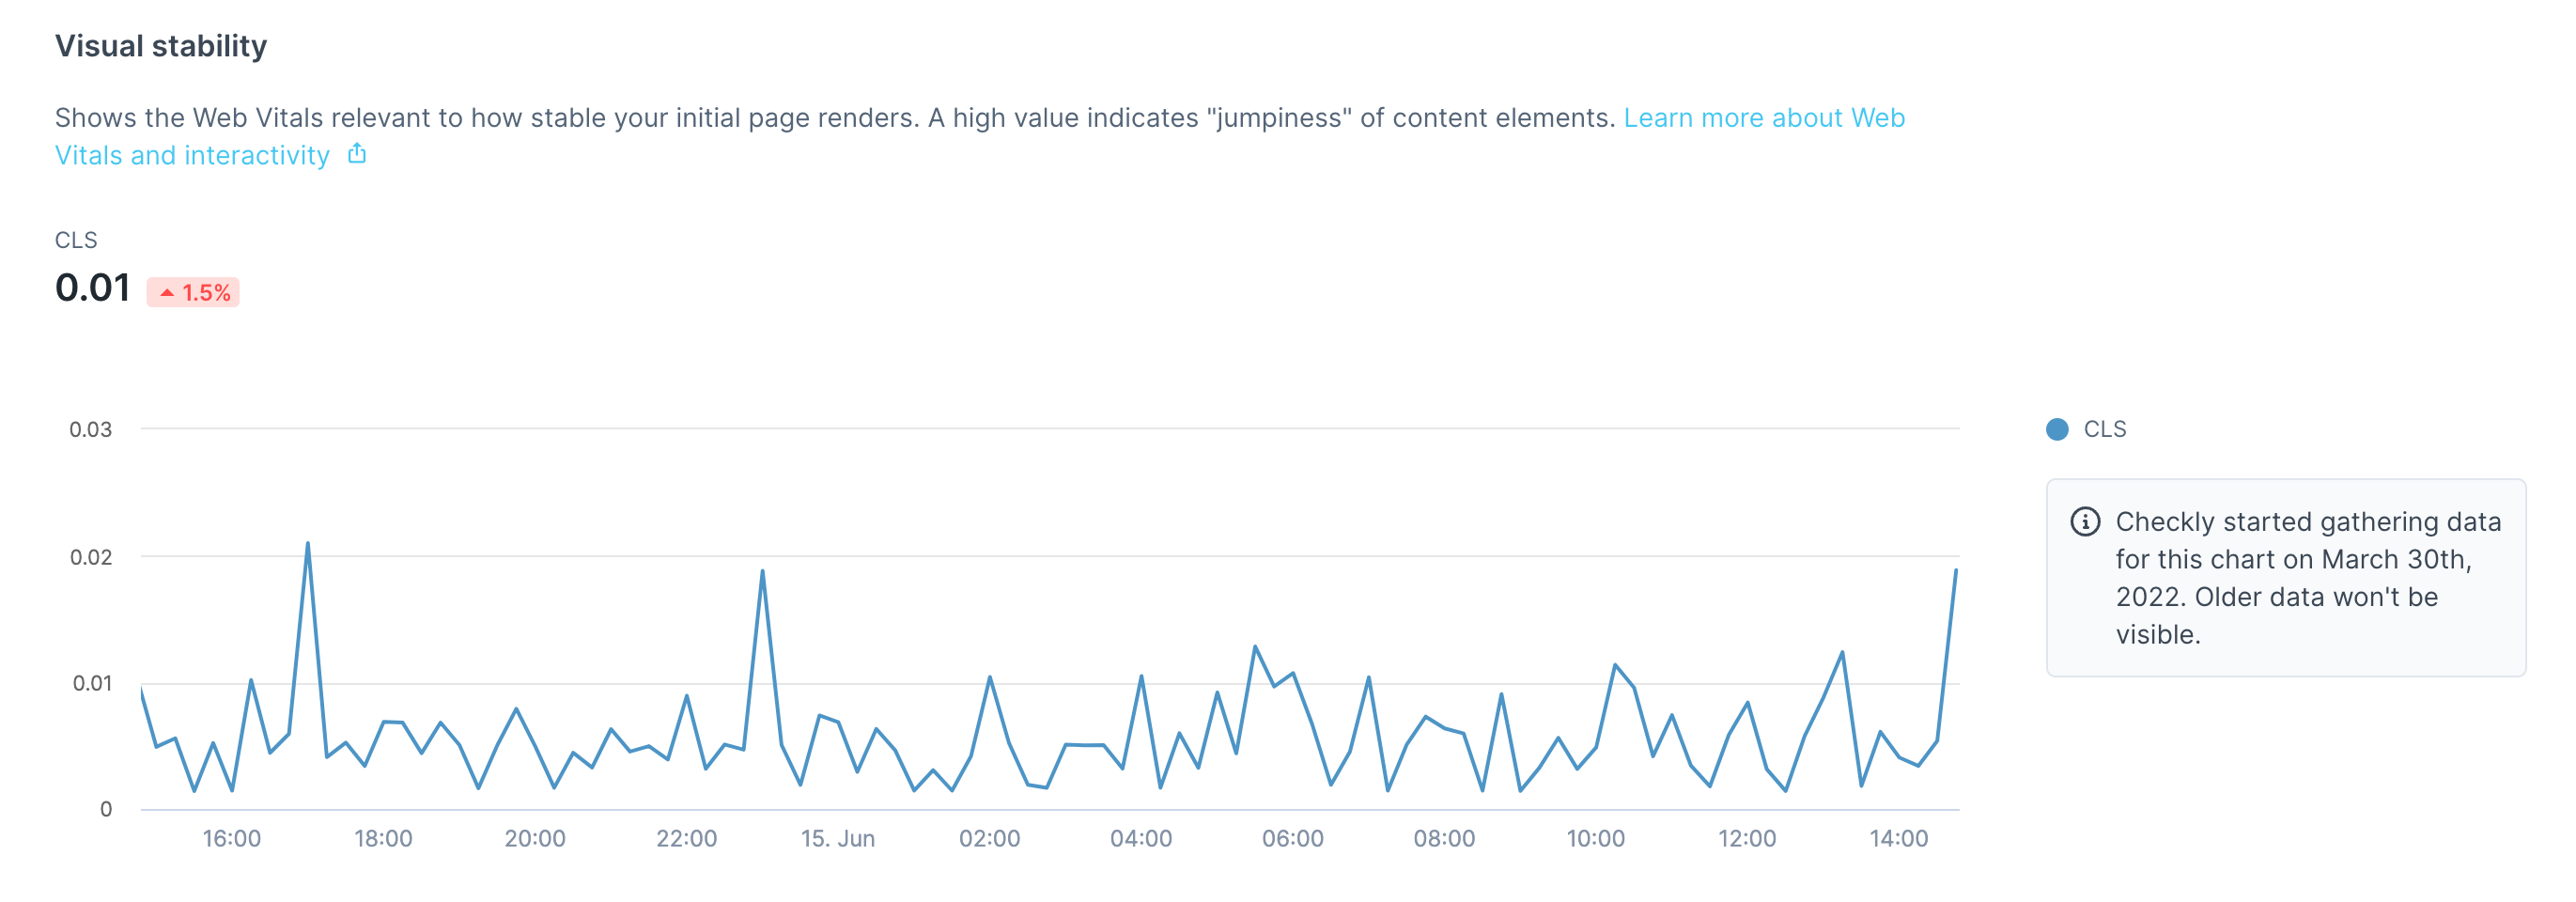
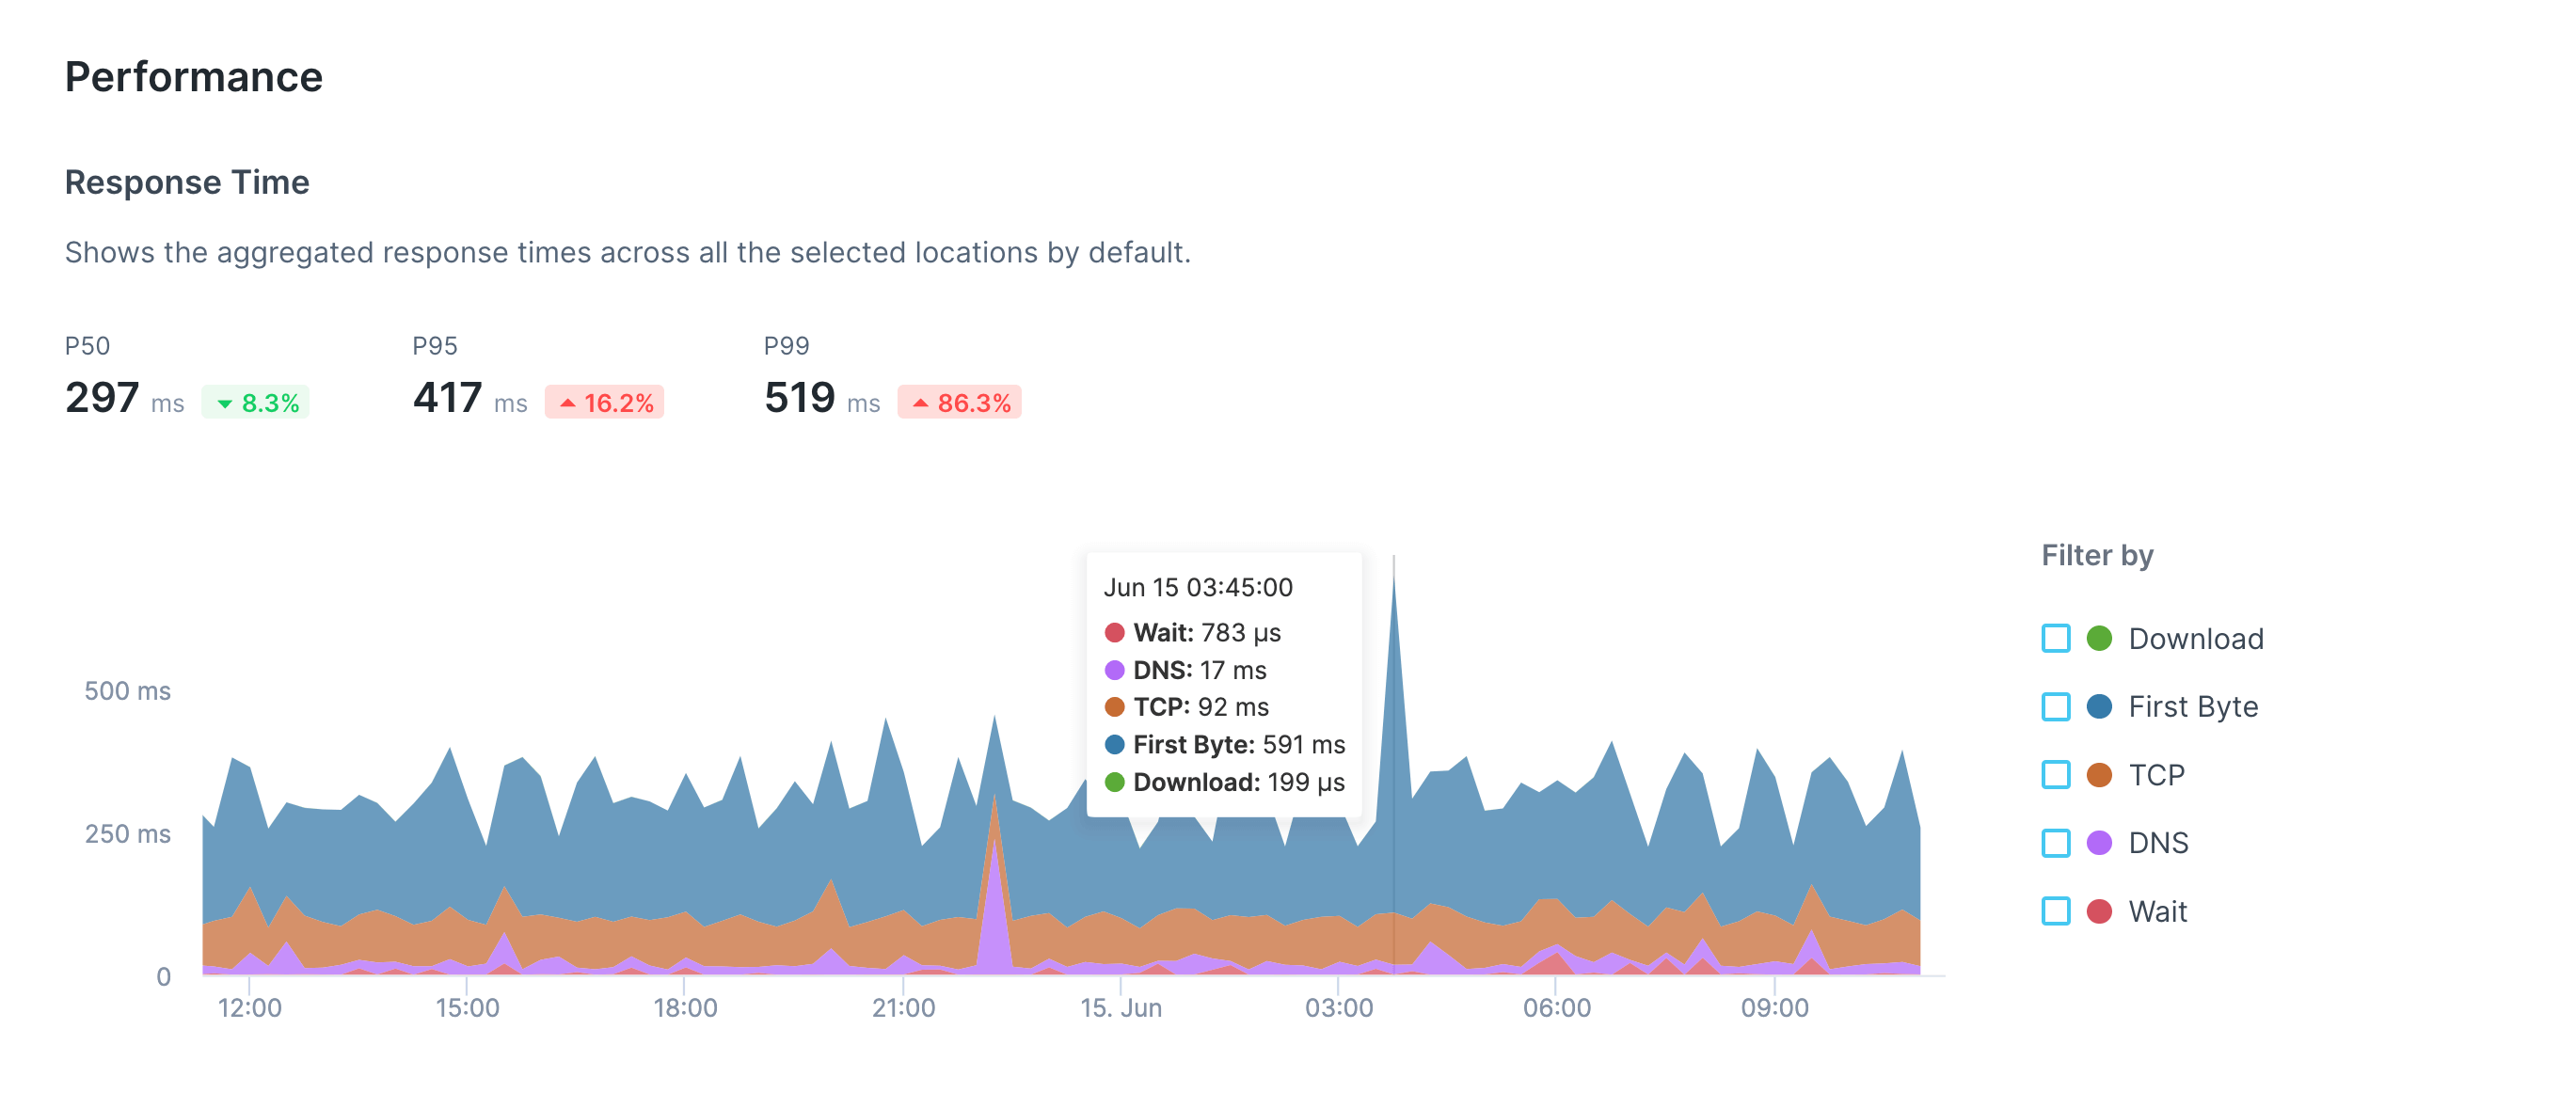
For API checks, a detailed response time breakdown is shown:
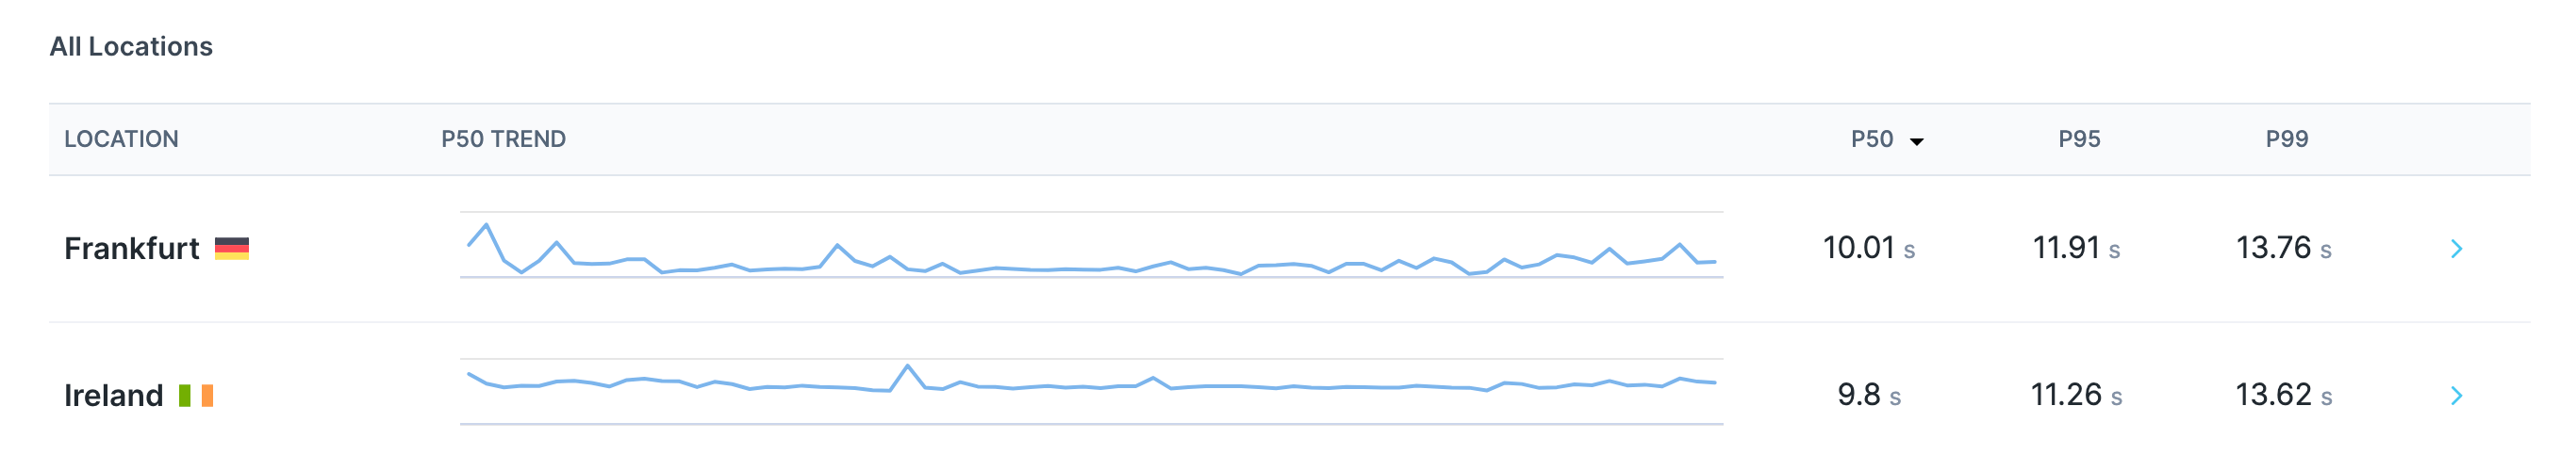
A performance comparison by location will also be included for both types of check:
Browser check results
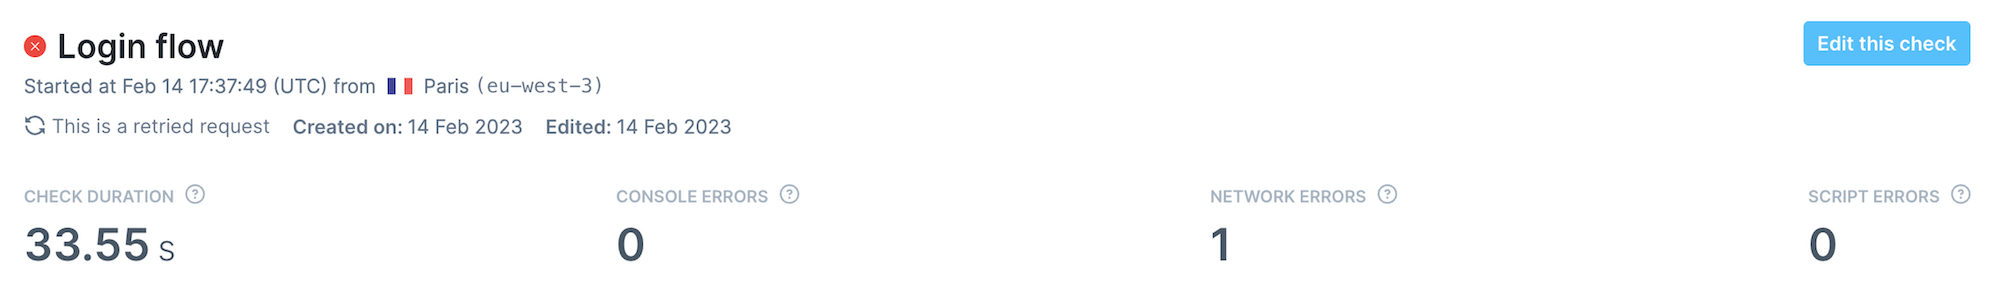
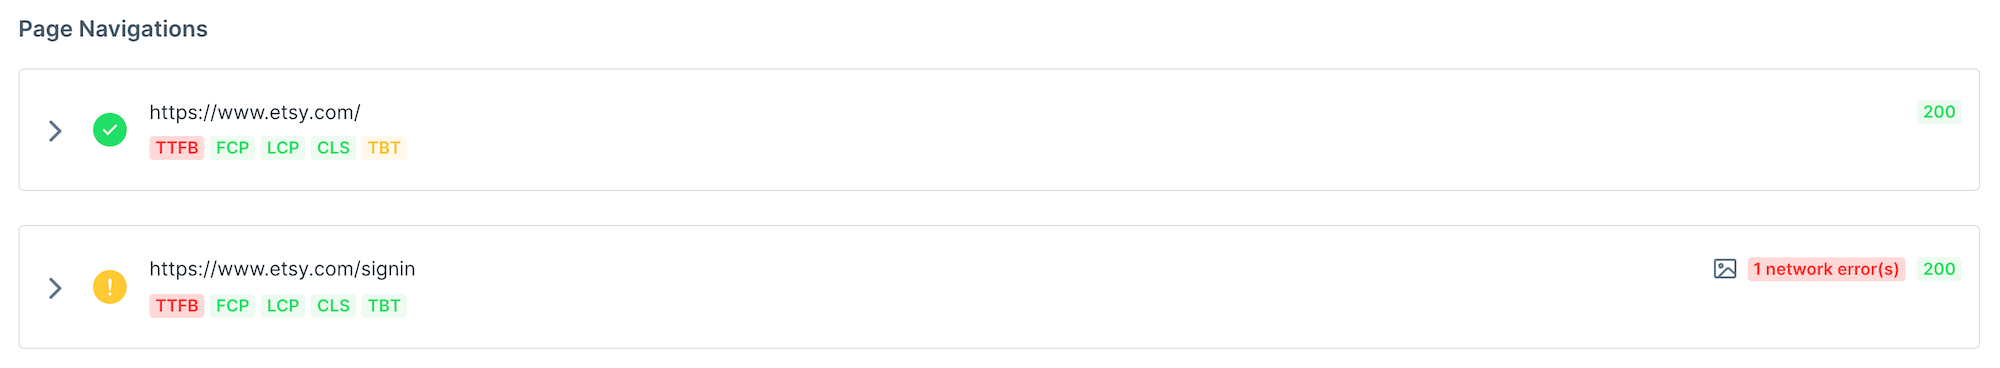
Individual browser check results contain:
- A short check summary, including errors broken down by category.
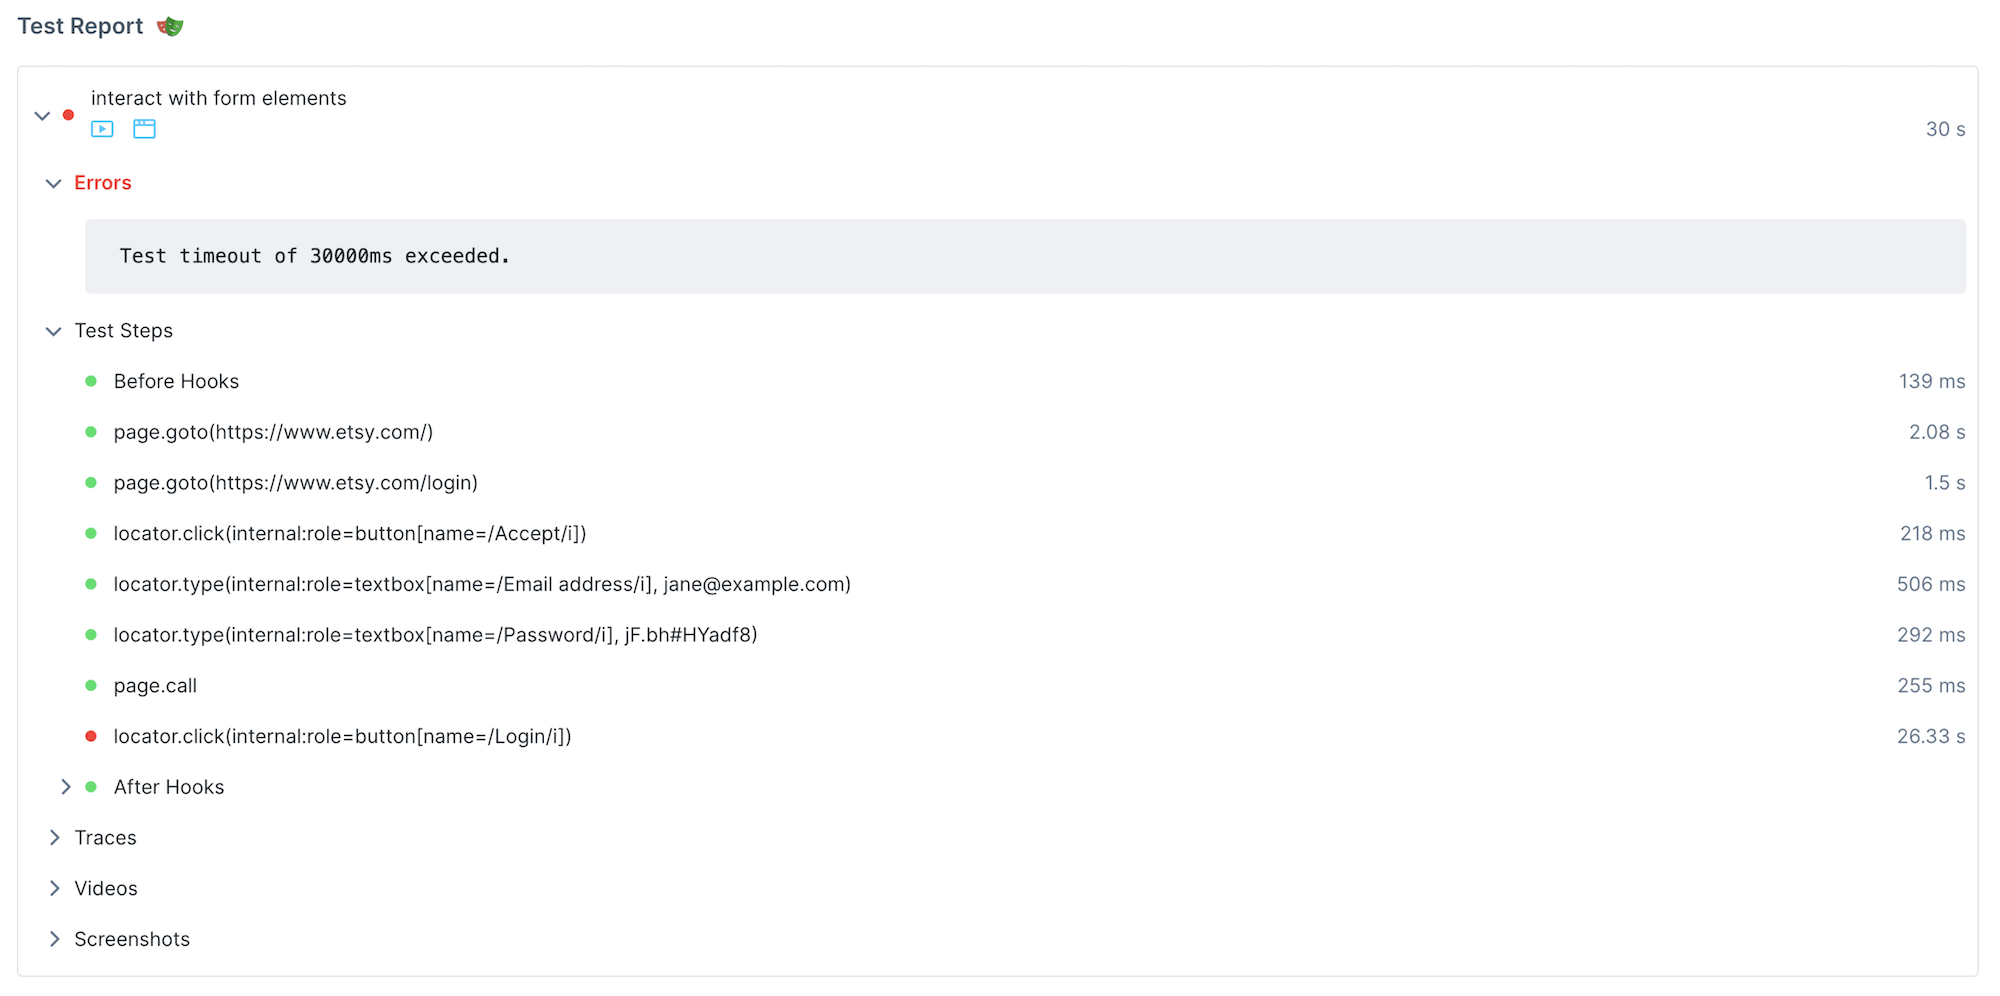
- When using Playwright Test Runner you will have an additional section displaying the test steps, error message, and assets (traces, videos, screenshots). Read more about the additonal functionalities of Playwright Test.
- A waterfall timeline showing how much time was spent on each page.
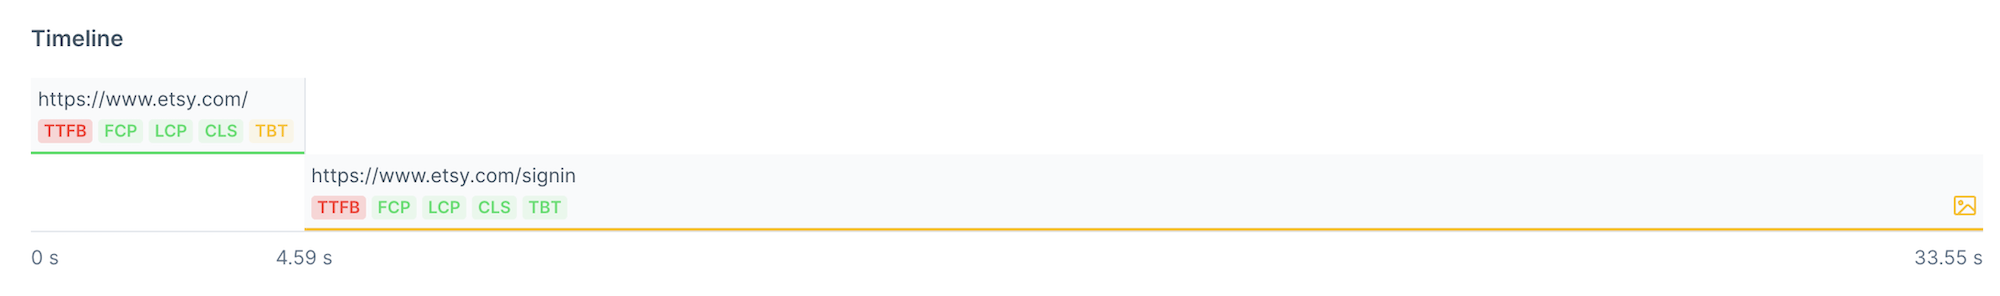
- An error log, only if your script failed.

- Expandable tabs on page your script navigated to.
 When expanded, each tab shows its own navigation/loading time ribbon and web vitals…
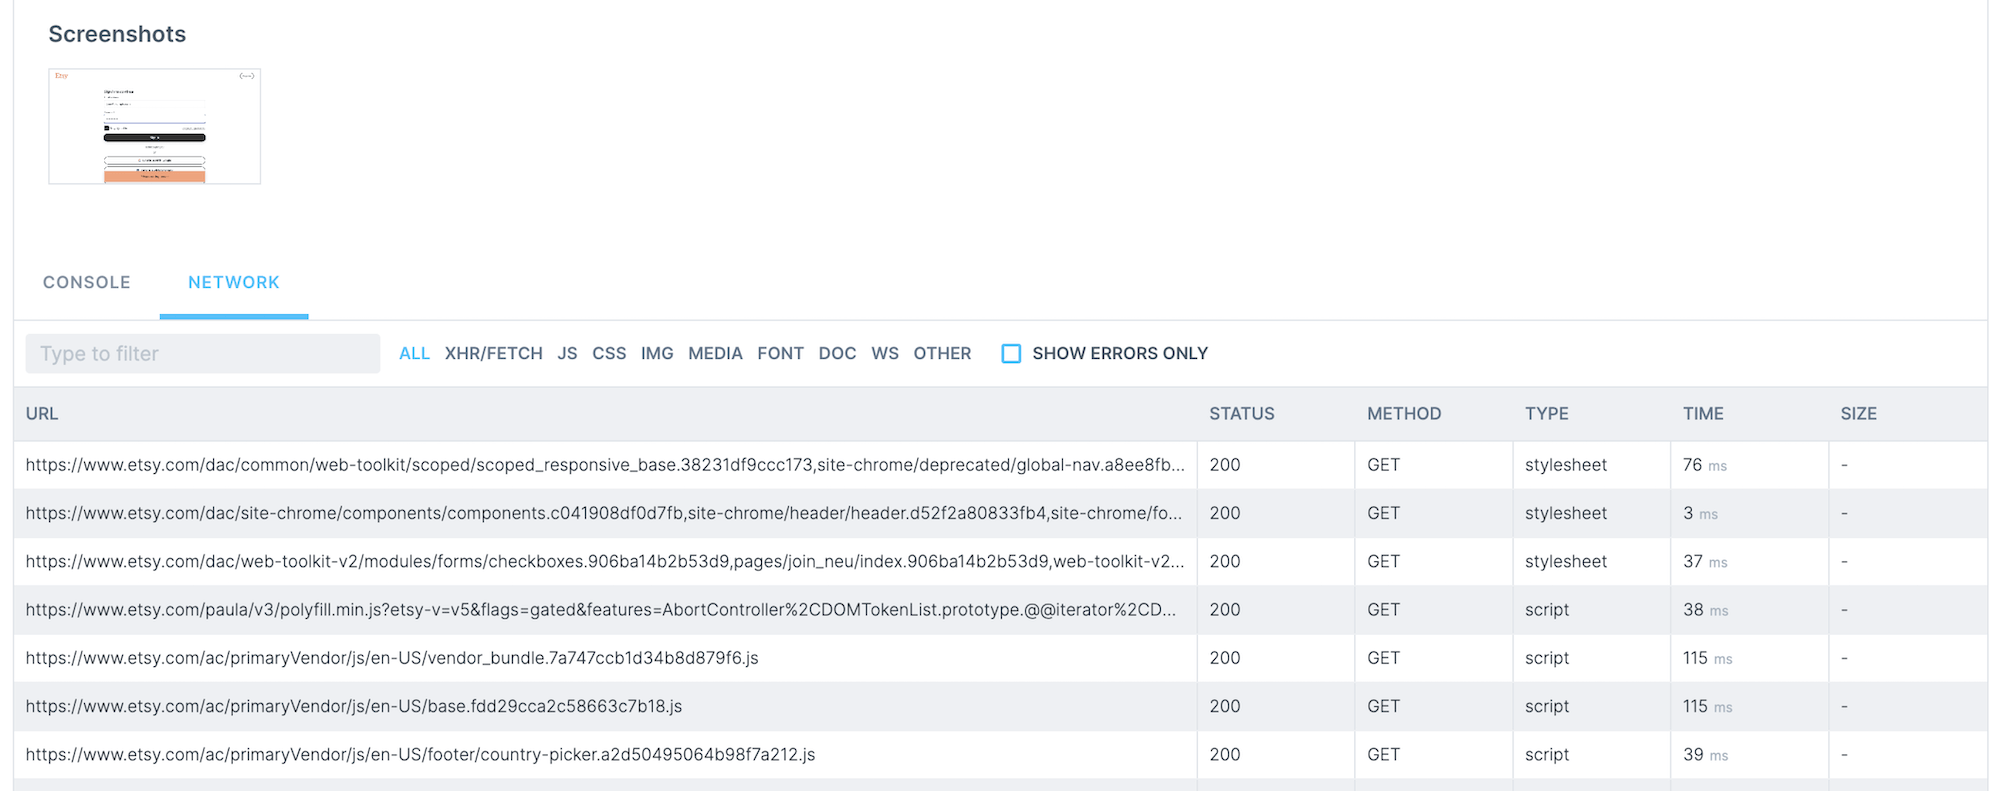
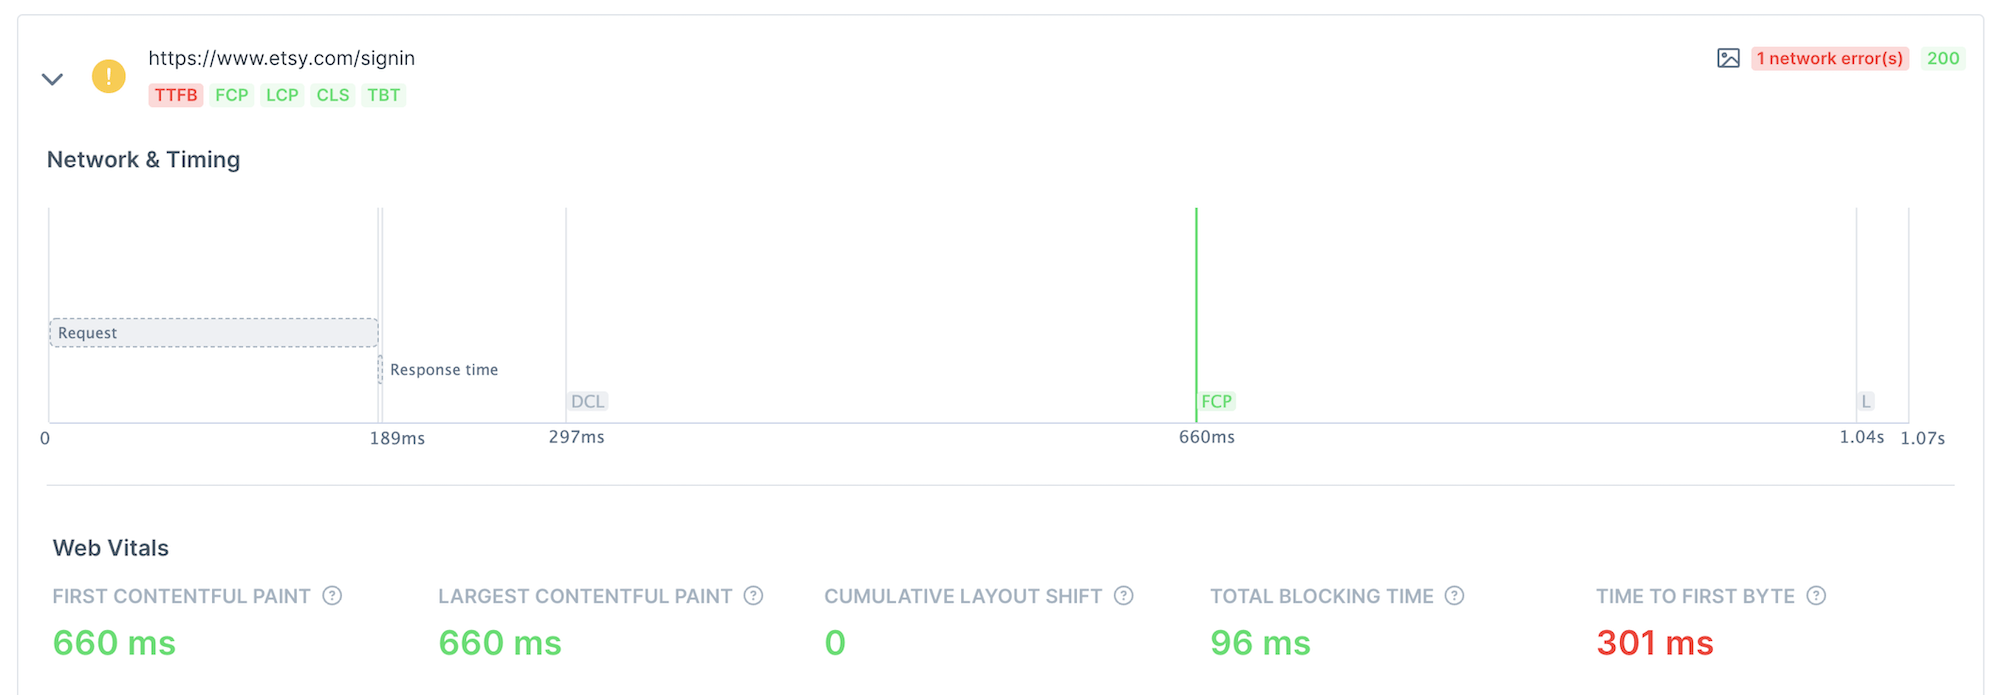 …together with browser console logs, network logs and any screenshots that had been taken (including one screenshot taken automatically on failure).
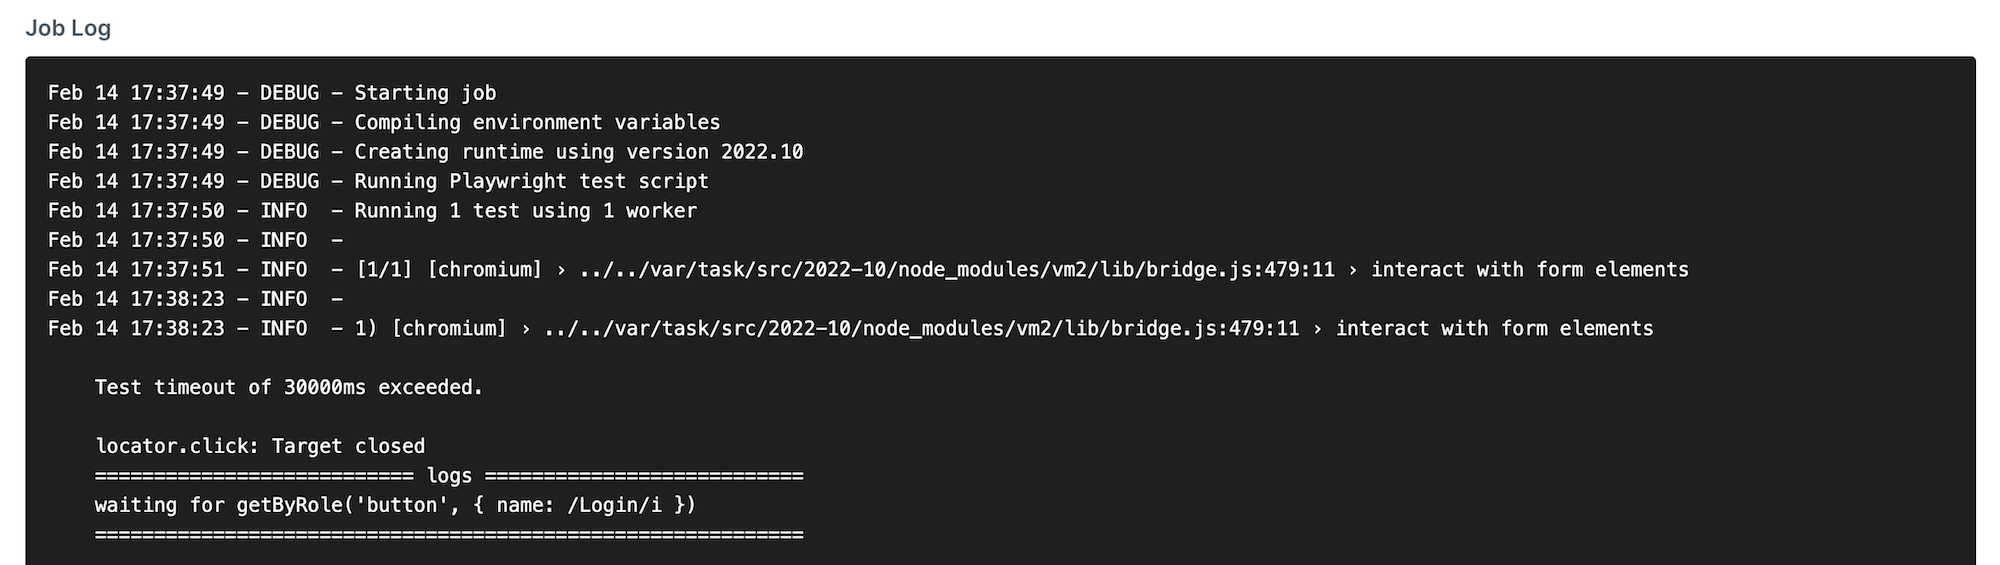
- A job log for the check.
API check results
API check results will expose key performance and correctness data about the HTTP response received from the target endpoint.
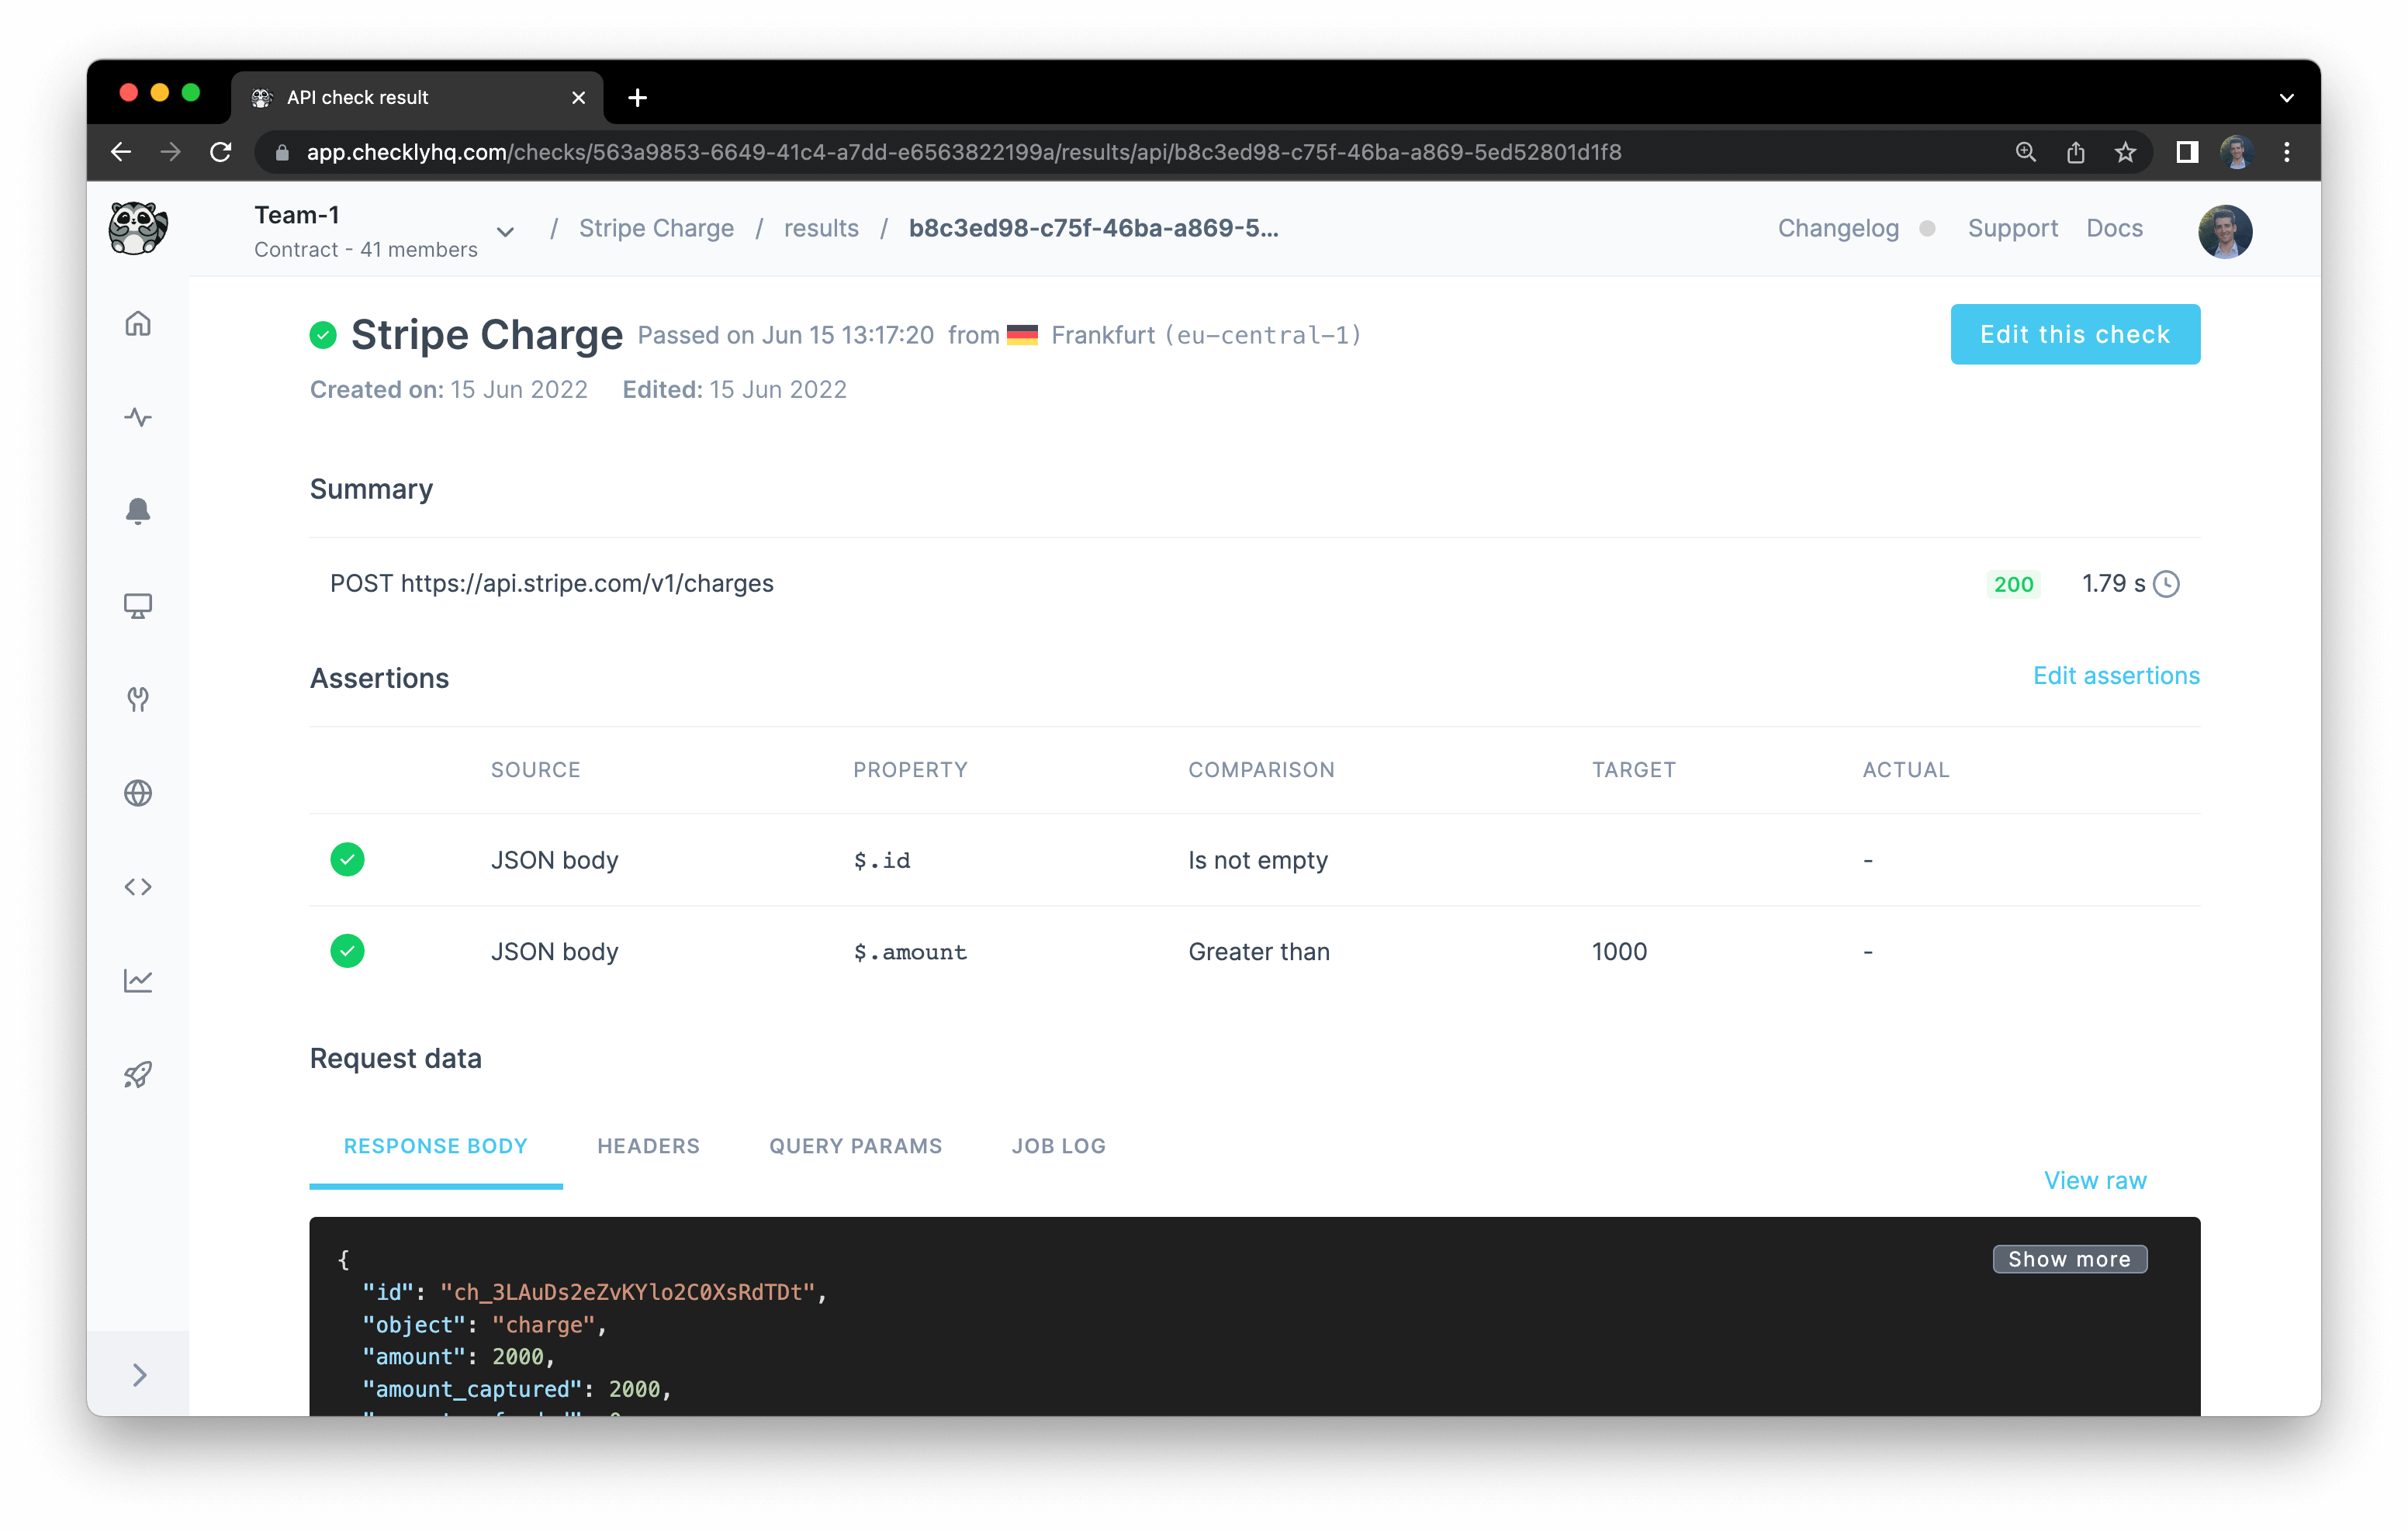
These include:
-
The request performed
-
Any assertions that were included in the check
-
All data related to the request and its response, such as
a. Response body
b. Request & response headers
c. Query params
d. Check job log
-
Timings, such as
a. Wait
b. DNS
c. TCP
d. First Byte
e. Download
![]() You can contribute to this documentation by editing this page on Github
You can contribute to this documentation by editing this page on Github